
Anu Rawal
Power BI & Python Data Analyst for business insights
New to Contra
Anu is building their profile!
Stock Performance Analysis Dashboard | MyStockBazar
Developed an interactive stock market analytics dashboard for MyStockBazar to evaluate and compare the historical performance of TCS, Infosys, and HCL using financial data from Yahoo Finance.
Key Responsibilities
• Collected and cleaned stock market data using Python
• Performed feature engineering for daily returns, volatility, and moving averages
• Conducted comparative stock performance analysis
• Built an interactive Power BI dashboard for business insights
Dashboard Highlights
• Daily Return Analysis
• Risk vs Return Comparison
• Moving Average Trends
• Monthly Performance Insights
• Cumulative Investment Growth Tracking
Tech Stack
Python | Pandas | yfinance | Power BI
Outcome
Enabled data-driven investment analysis through interactive visualizations and financial performance tracking.
0
9
How can data and AI help in wildlife conservation? 🐦
I built an interactive Streamlit dashboard that uses machine learning to classify 867+ bird species with 97% accuracy, helping uncover patterns and insights for conservation efforts.
🔹 Built a classification model to accurately identify bird species
🔹 Developed an interactive dashboard for exploration & insights
🔹 Enabled data-driven understanding of species distribution and behavior
Tools: Python | Streamlit | Scikit-learn | Pandas | Machine Learning
💬 Interested in building intelligent, data-driven solutions like this? Let’s connect. 🚀
0
39
Confused about which LLM gives the best value for your money?
I built an interactive Streamlit dashboard to analyze 200+ LLMs based on cost vs performance, helping users make smarter, data-driven model choices.
🔹 Compared models using performance_per_dollar & speed_per_dollar
🔹 Introduced a “Value Quadrant” to quickly identify best ROI models
🔹 Simplified LLM selection with clear, actionable insights
Tools: Python | Streamlit | Pandas | Data Visualization
💬 Want to optimize cost vs performance for your AI projects? Let’s connect. 🚀
0
47
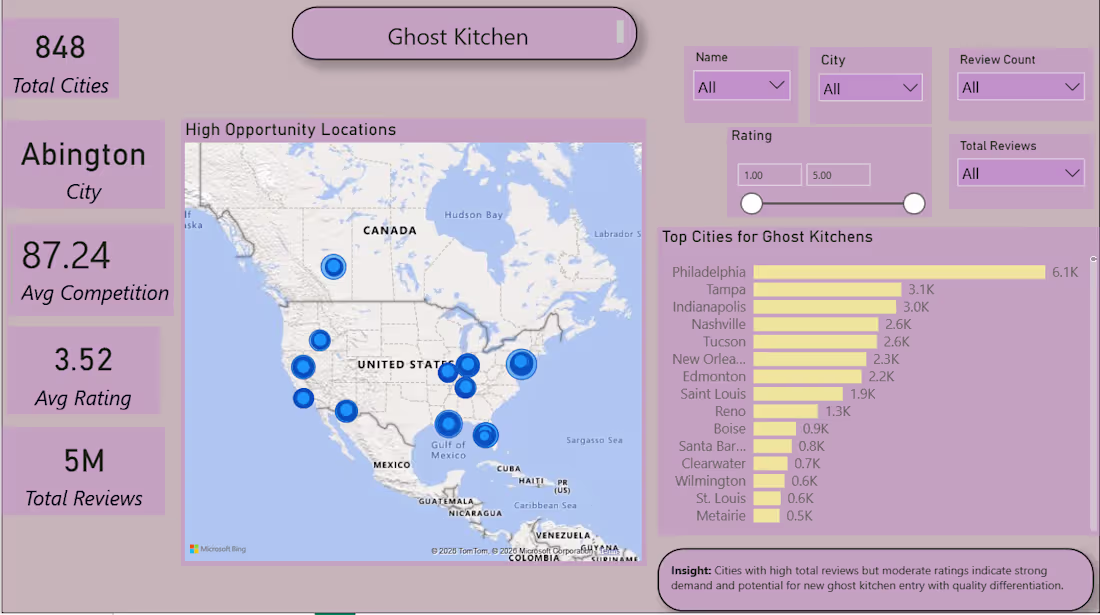
Struggling to find the right location for your ghost kitchen?
I built an interactive Power BI dashboard using 5M+ Yelp reviews across 848 cities to identify high-opportunity locations by analyzing demand, ratings, and competition, helping businesses make smarter, data-driven decisions.
🔹 Identified cities with high demand but manageable competition
🔹 Reduced analysis time by ~90% with automated insights
🔹 Delivered clear, actionable recommendations for expansion
1
51
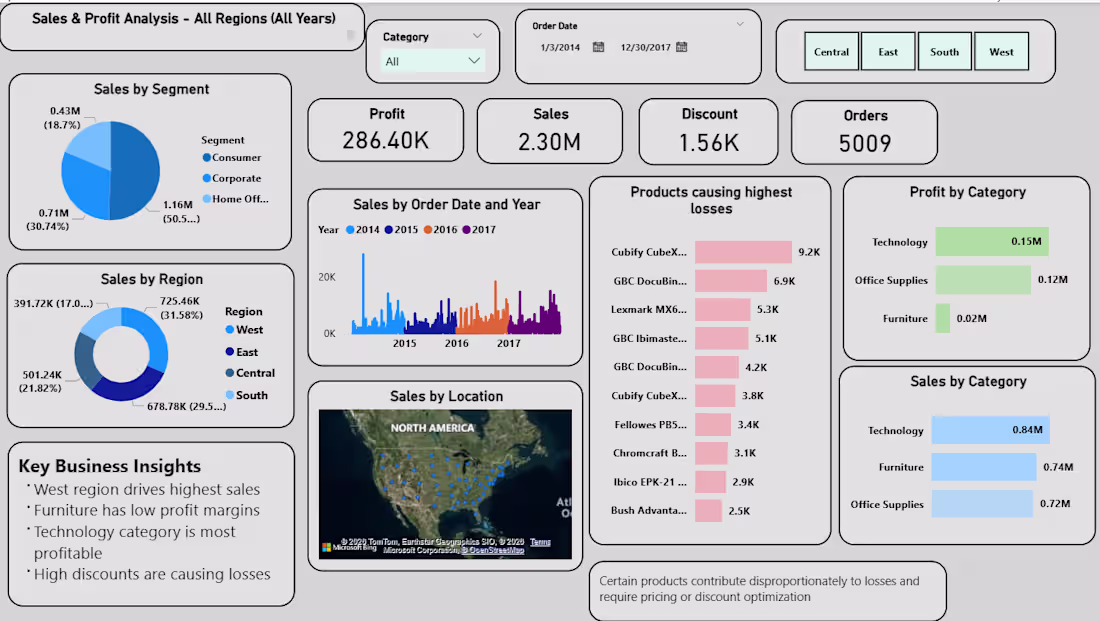
Designed a Power BI dashboard to analyze retail sales performance and uncover hidden losses. Performed data cleaning and analysis to identify trends, highlight top loss-making products, and evaluate the impact of discounts on profitability. Delivered actionable insights to support better pricing strategies and business decisions.
Tools: Power BI, DAX, Python, Excel
1
95