
Amirhossein Arashpour
Driving growth with custom Power BI dashboards.
New to Contra
Amirhossein is building their profile!
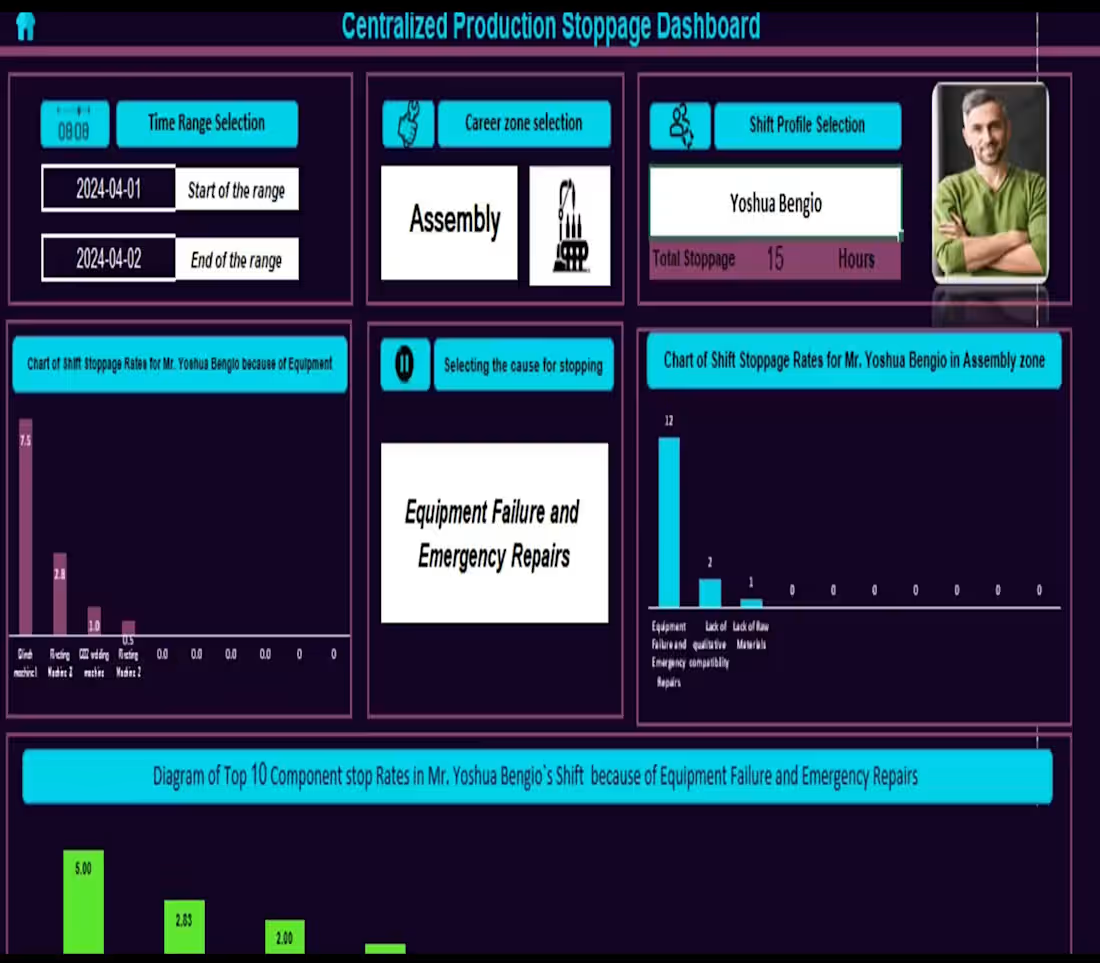
A stop in production is a temporary or permanent interruption in the production process that may occur due to various reasons including equipment failure, material shortages, quality control issues, product or batch changes, and others.
Overall, understanding the causes and consequences of stops in production is crucial for manufacturers to develop effective strategies to minimize their impact and maintain efficient production operations.
This dashboard is a designed tool for monitoring daily production stoppages, categorizing the data by time periods,shift and zone of operation to provide a clear and organized overview of production stops and disruptions.
With the selection of desired parameters, the number of stoppages that occurred with a unit of time in hours and by stoppage reasons is displayed.
Then, by selecting the desired stoppage reason, a diagram showing the distribution according to equipment type and product type being produced in the relevant shift is available for viewing and tracking.
The obtained information can serve as a basis for identifying production risks, weaknesses and strengths, and also for managers' decision-making regarding the implementation of corrective actions and observing the effectiveness of these actions in the short or long term.
0
8
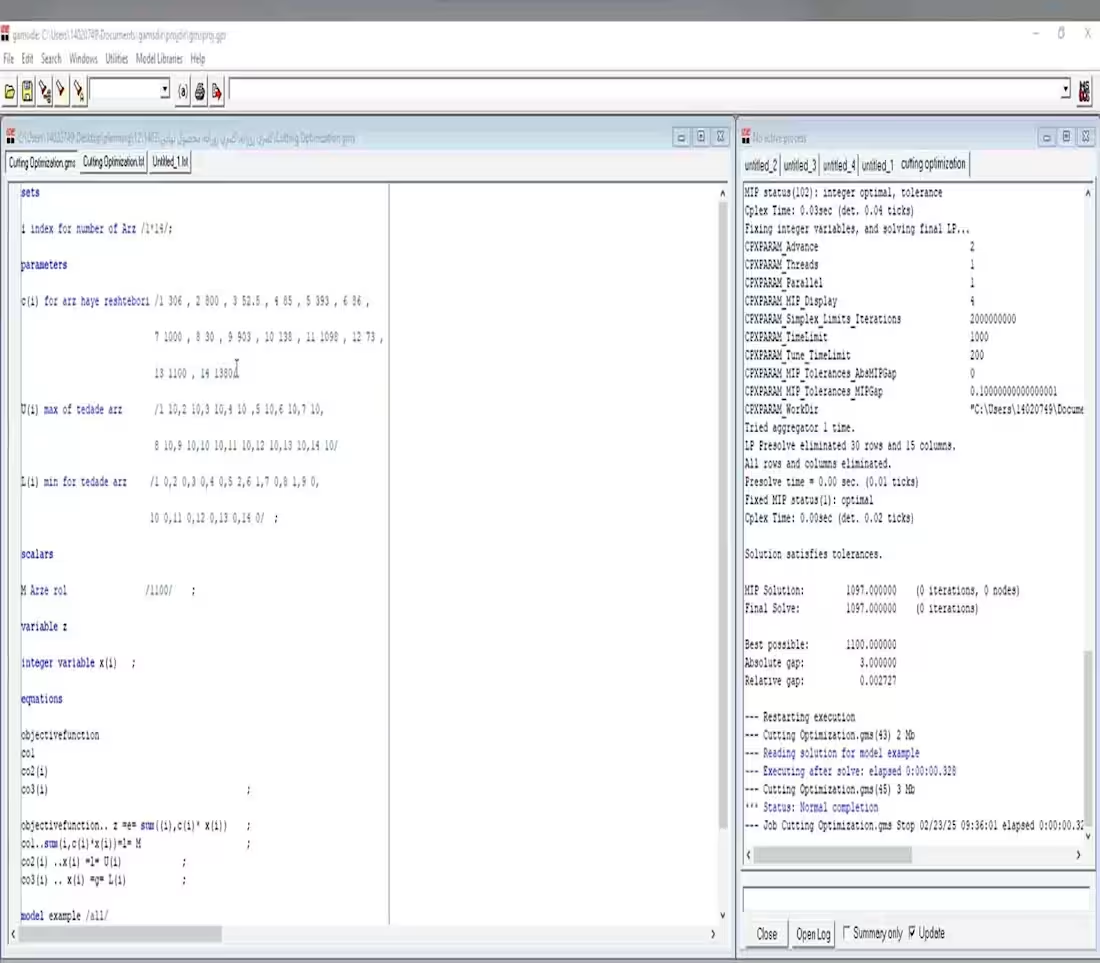
Manufacturing: My Journey into Optimization
In the fast-paced world of manufacturing, every ounce of efficiency counts. The challenge of minimizing waste while maximizing production outputs is vital for ensuring sustainable practices and profitability. Recently, I embarked on an exciting project focused on optimizing the cutting of steel and galvanized sheets—a crucial process in various industries.
Through the power of GAMS, I developed an optimization model that addresses this challenge head-on. The goal was to maximize production plans while minimizing material waste, leading to both environmental and economic benefits. Here are some key aspects:
• Developing a robust mathematical model to represent the cutting process.
• Implementing efficient algorithms to solve the optimization problem.
• Validating the model with real-world data.
The results have been impressive, with significant reductions in material waste and enhanced production efficiency. I’m eager to connect with fellow professionals to discuss how optimization can transform manufacturing processes!
0
11
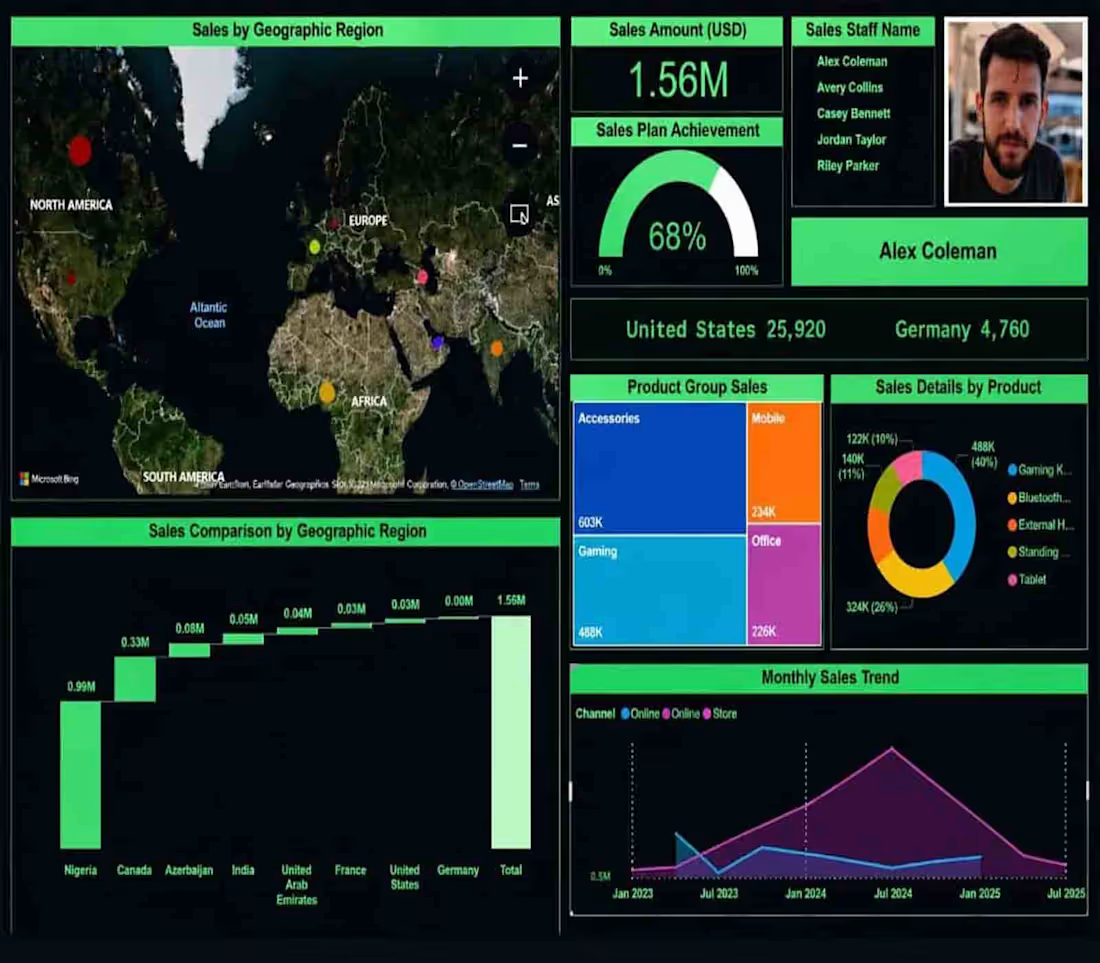
Interactive sales analytics dashboard for a global retail business.
What it shows:
Sales by geographic region with a live world map to spot top‑performing countries at a glance.
Revenue performance vs. plan, including sales plan achievement (e.g. 68%) and total sales amount (USD).
Product insights via tree map and donut charts to compare product groups and individual product performance.
Channel & time analysis with monthly sales trends for online and in‑store channels.
My role:
Designed and built the entire dashboard layout, data model, and visual interactions to help the sales team quickly identify growth opportunities and underperforming regions.
0
28
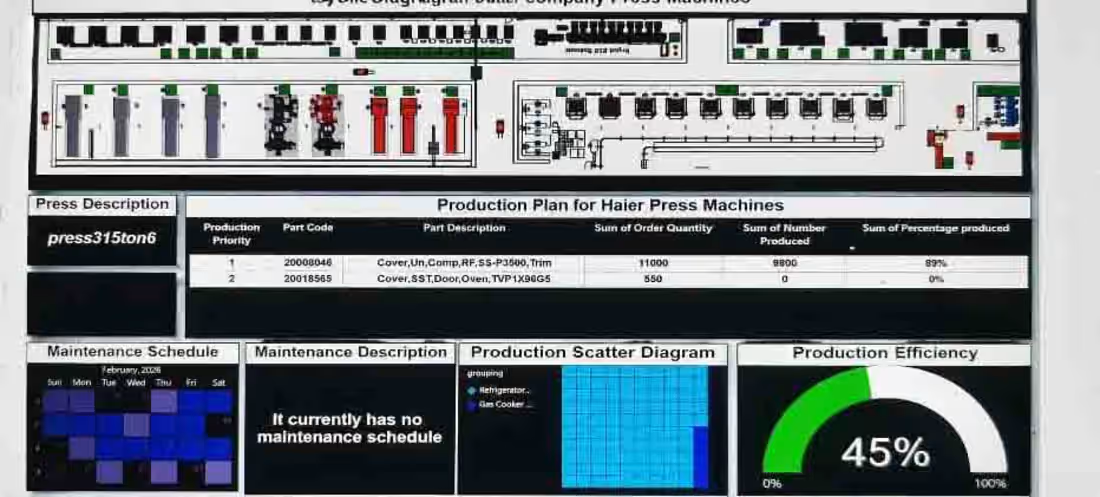
Building data-driven solutions for smart manufacturing. This dashboard provides real-time visibility into production efficiency, maintenance scheduling, and order tracking for high-capacity press machines.
Key Features:
Live Production Tracking: Monitoring real-time output against targets (reaching 89% production progress).
Operational Intelligence: Visualizing production efficiency and scheduling to minimize downtime.
Data Visualization: Converting complex manufacturing metrics into actionable insights for floor managers.
Helping factories optimize their workflow and make informed decisions through intuitive UI/UX and data analytics.
0
30