
Muhammad ALI
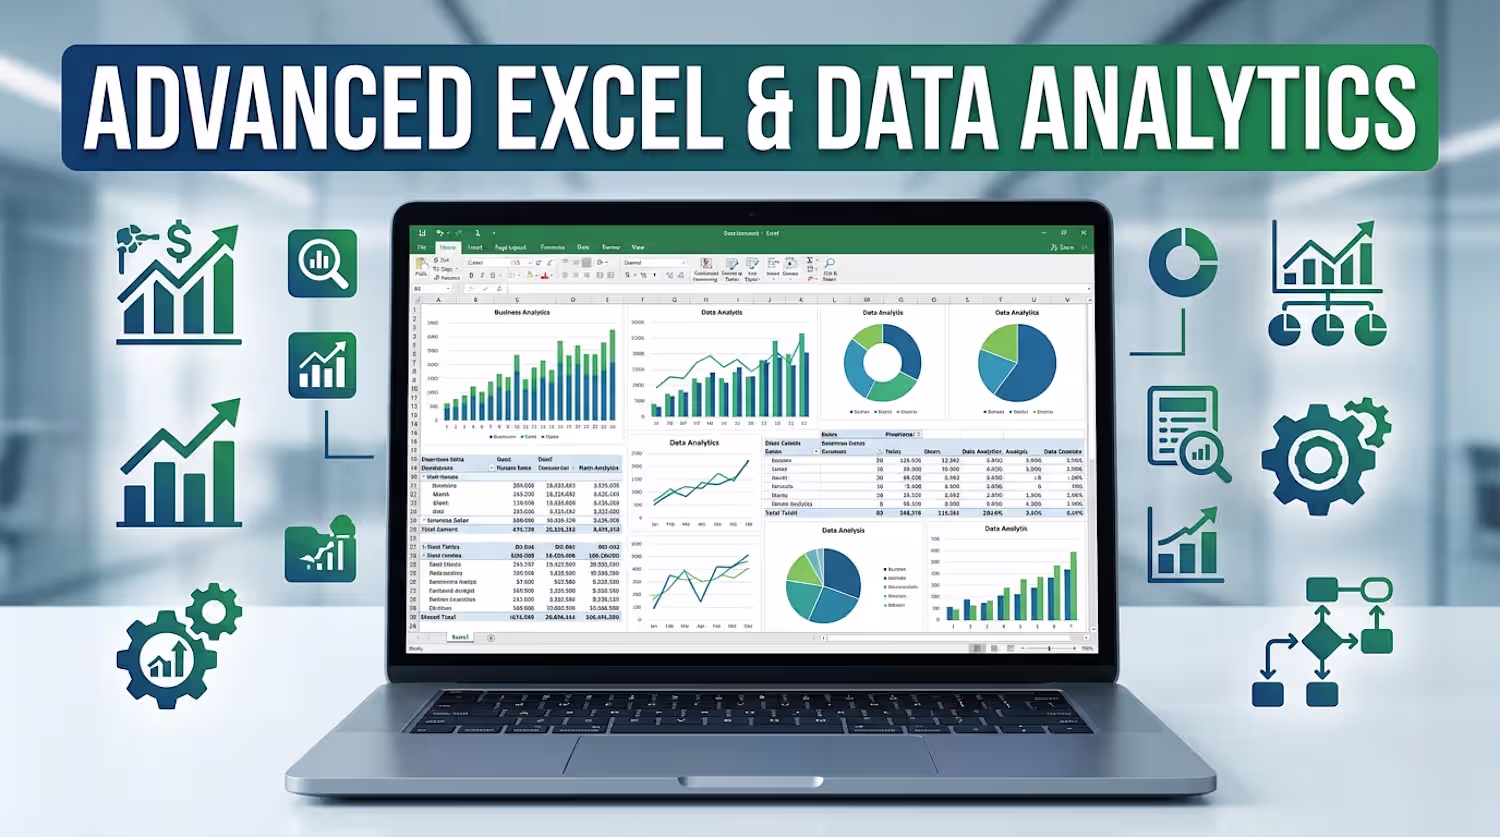
Advanced Excel & Data Analysis for clear business insights
New to Contra
Muhammad is ready for their next project!
Power BI Developer | Data Analyst | DAX | Business Intelligence
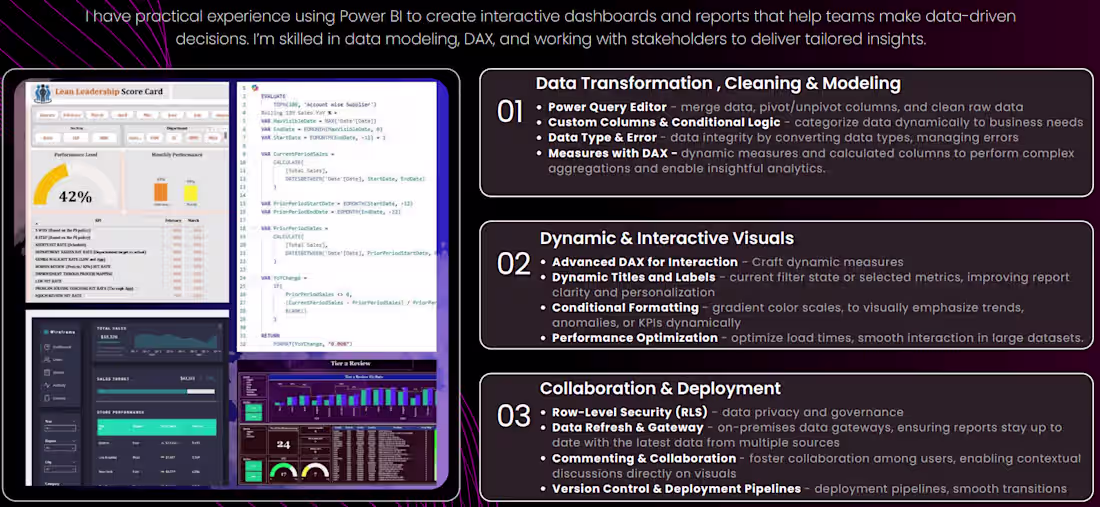
I build interactive Power BI dashboards and reports that help teams make data-driven decisions. Skilled in data modeling, DAX, Power Query, and stakeholder collaboration.
1
32
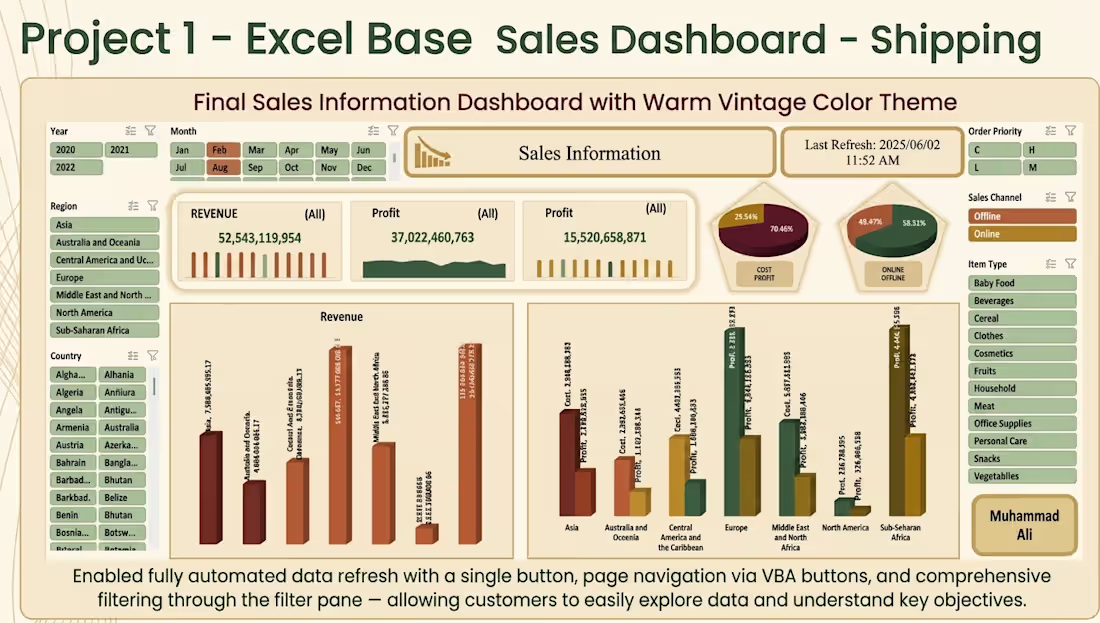
Interactive Sales Dashboard | Excel BI with Dynamic Filters & VBA
Hi, I'm Muhammad Ali.
I built this Excel dashboard because I saw too many business owners drowning in spreadsheets — rows and rows of data, but no clear answers.
So I created something different.
📊 What This Dashboard Does
It takes raw shipping/sales data and turns it into a simple, interactive dashboard. Click a button. Filter by year, region, or product. Instantly see your revenue, profit, and margins.
No complicated software. No coding. Just Excel.
🔍 What You Can Do With It
Filter by Year (2020, 2021, 2022), Month, Region, or Country
Get real-time updates on total revenue and profit.
Quickly check the margin %
Separate performance into 12 or more product categories, such as baby food, drinks, clothes, and so on.
Compare sales channels that are online and offline
Sort by Order Priority (C, H, L, or M)
⚙️ What Makes It Unique
One-click data refresh: update everything with just one click
VBA-powered navigation — move between pages easily
Pivot tables with slicers — instant filtering, no formula errors
Clean, warm-vintage color theme—comfortable for all-day use
Last refresh timestamp — so you always know your data is current
📈 Real Insights You Can Get
Total Revenue: $52.5B+
Overall Profit Margin: ~29.5%
Which regions are performing best?
Which product categories drive the most profit?
How do online and offline sales compare?
📎 What You'll Receive
Fully editable Excel file (.xlsx or .xlsm)
Simple PDF guide (how to use the dashboard, how to refresh data)
💼 Who Is This For?
Business owners who want to understand their sales without hiring a data team
Operations managers who need fast answers
Anyone tired of messy spreadsheets
👨💻 Built by me, Muhammad Ali
I focus on making data useful — not just pretty. If you need a custom dashboard for your business, I'd love to help.
📬 Message me on Contra to get started.
4
1
95
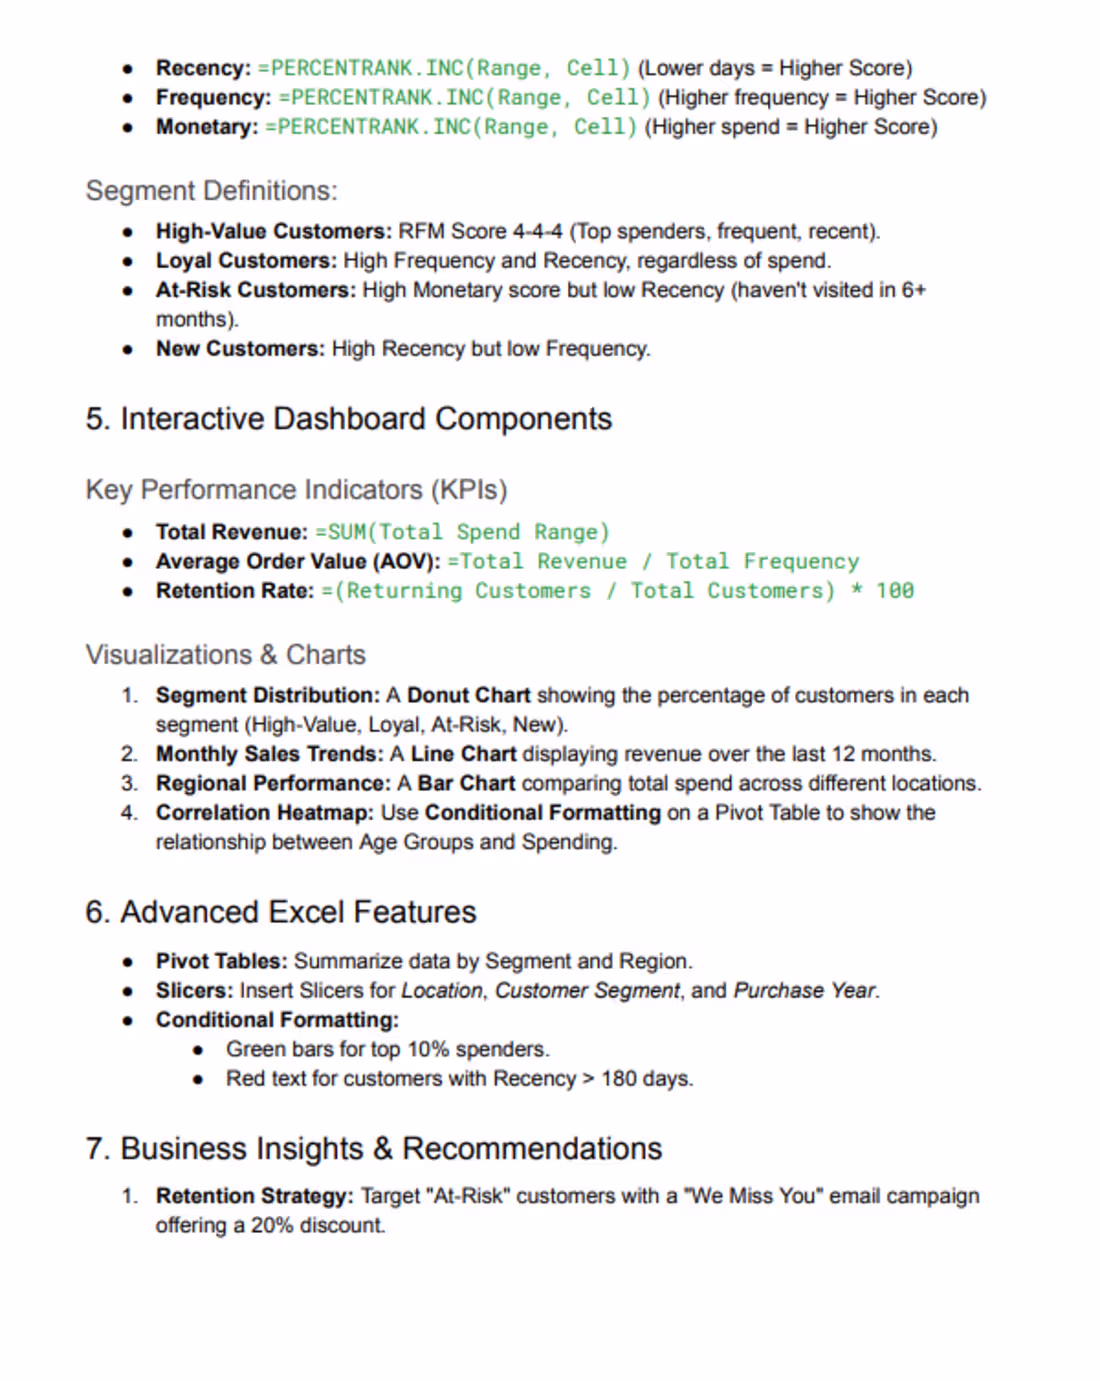
Customer 360 Analytics & RFM Segmentation Tool | Advanced Excel Dashboard
Customer analytics dashboard using RFM (Recency, Frequency, Monetary) segmentation. Identifies High-Value, Loyal, At-Risk, and New customers. Includes interactive KPIs, segment distribution chart, monthly sales trends, regional performance, and actionable business insights for retention and upselling strategies.
4
2
174
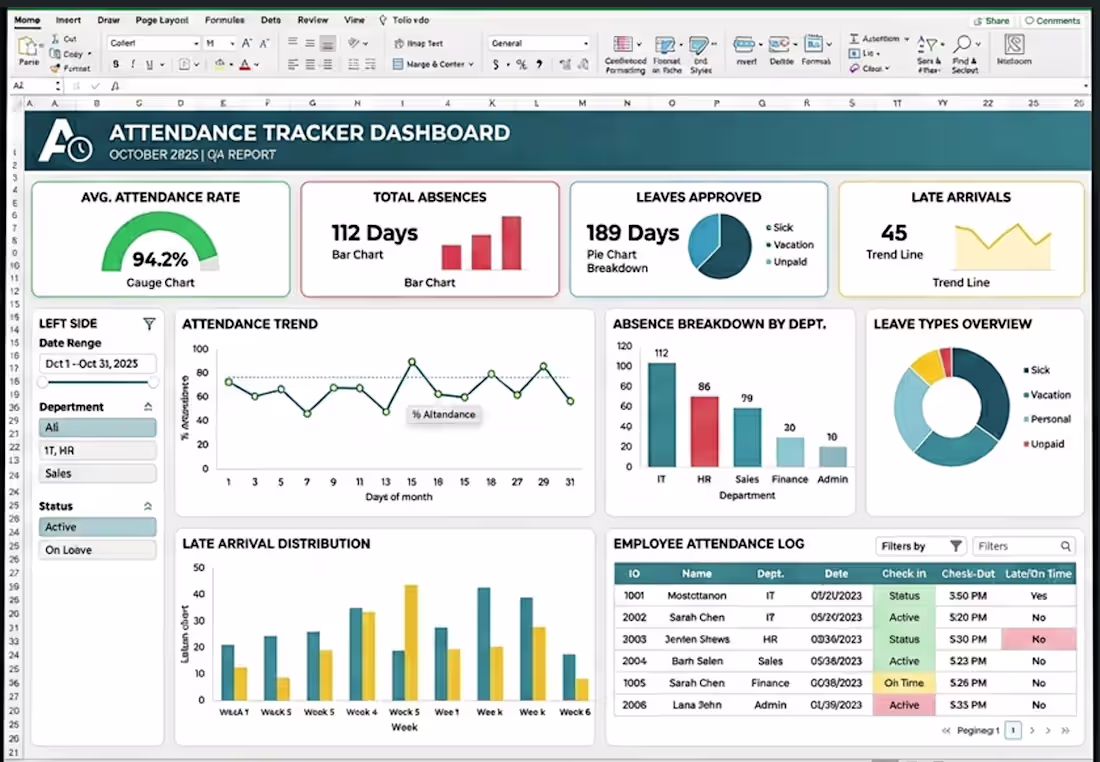
Employee Attendance Tracker
Employee attendance dashboard tracking 94.2% average attendance rate, 112 absences, 189 approved leaves, and 45 late arrivals. Includes department filters, attendance trends, absence breakdown by type (Sick, Vacation, Unpaid), and employee attendance log.
0
114
Category Value Analysis
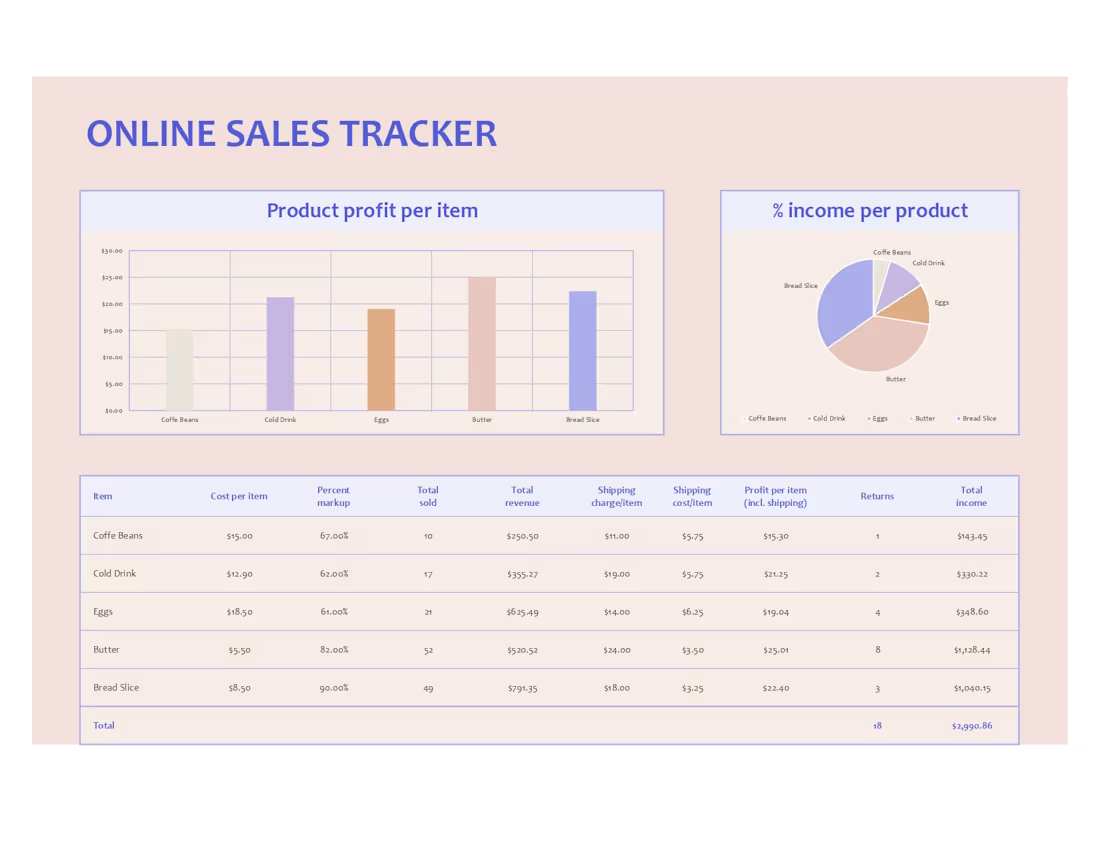
I built a product category value analysis dashboard in Excel that breaks down pricing across 5 categories: Coffee Beans ($15), Cold Drink ($12.90), Eggs ($18.50), Butter ($5.50), and Bread Slice ($8.50). Total value analyzed: $100. This helps businesses understand product-wise contribution and pricing distribution.
1
113
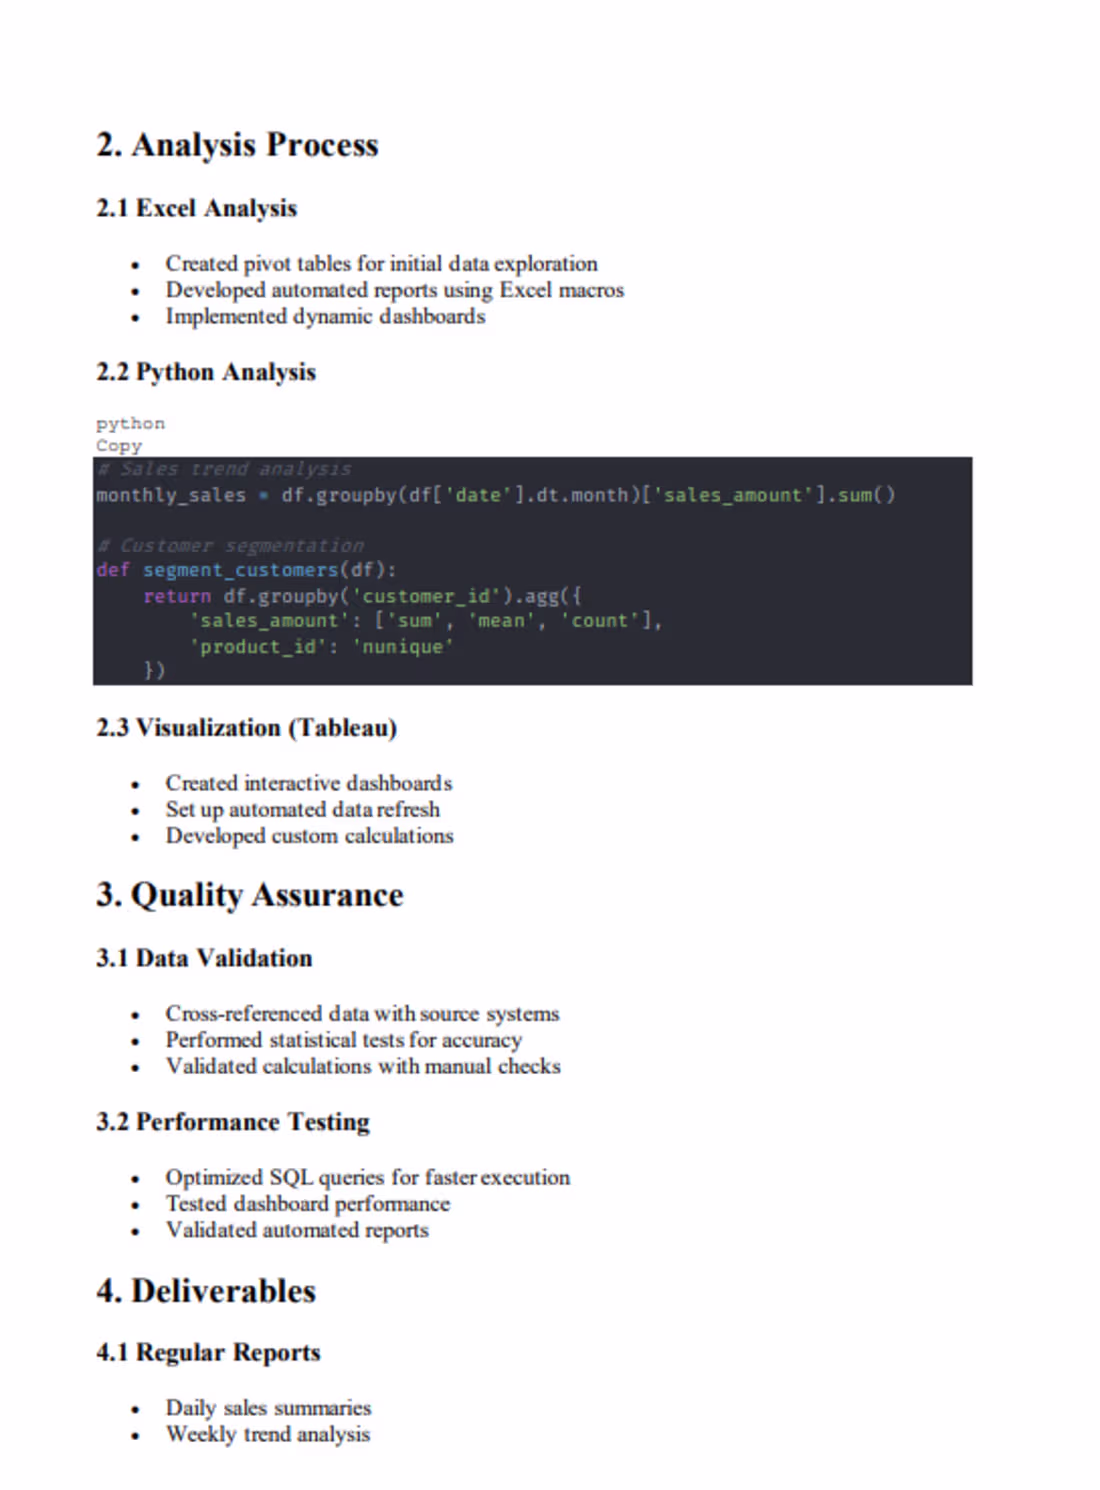
Sales Analysis Dashboard | SQL | Python | Excel | Tableau:
This sales analysis project used SQL, Python, Excel, and Tableau to analyze two months of sales data. Key findings include 15% revenue growth, top 3 products contributing 65% of revenue, and 78% customer retention. Recommendations include inventory optimization, targeted marketing, and automated reporting saving 10 hours per week.
1
130
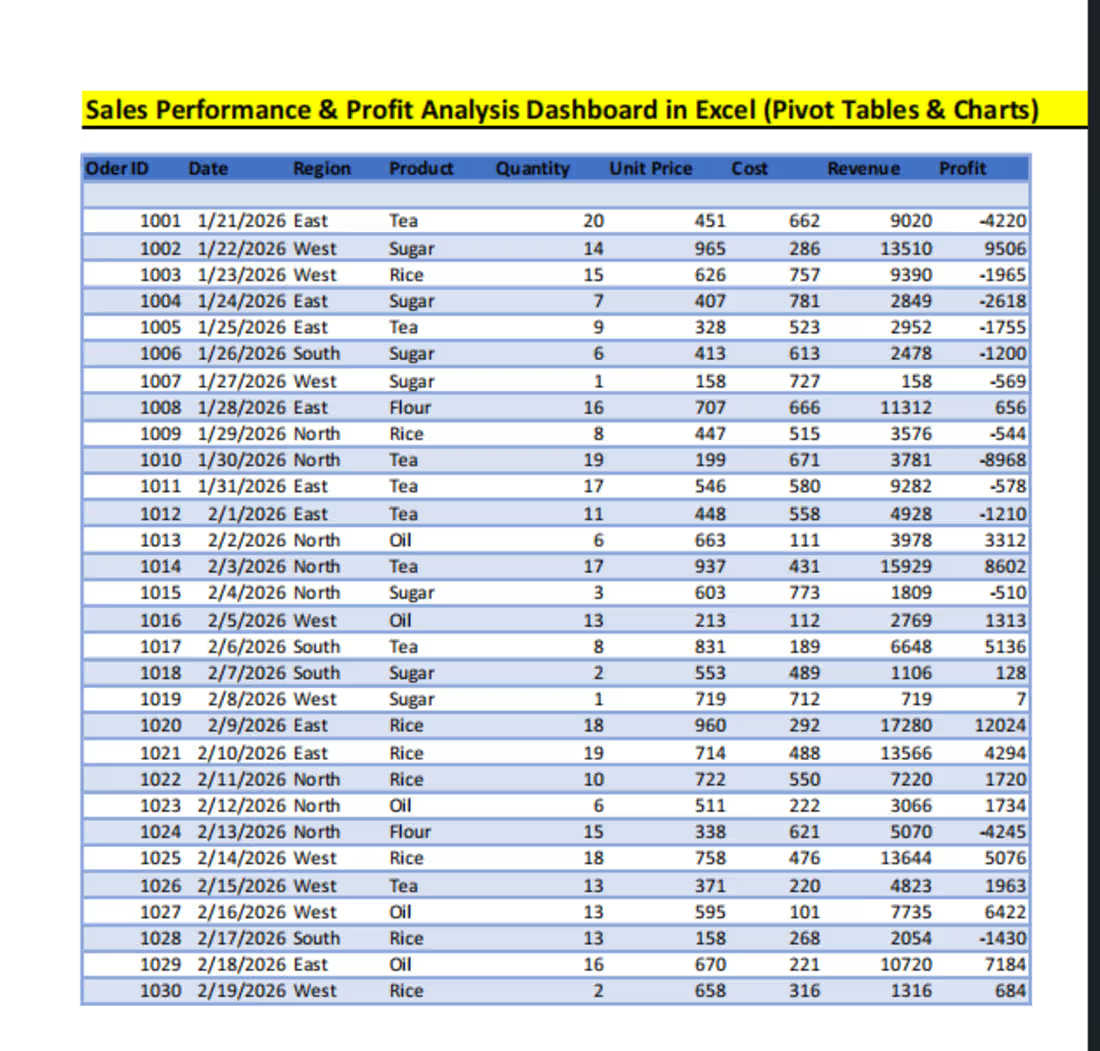
I built an interactive Excel dashboard that analyzes product profit and revenue. The dashboard includes PivotTables, bar charts, and slicers to filter by region and product. It helps businesses quickly see which products are making money and which are not.
1
1
190