
A.K.M Mostakim Shadhin
"Data Analyst in Training | Proficient with Power BI,Tableau
New to Contra
A.K.M Mostakim is ready for their next project!

This project showcases an interactive Power BI dashboard designed to transform raw sales data into clear, actionable business insights. The dashboard focuses on analyzing sales performance, product trends, and overall financial KPIs to support better decision-making.
Key features include dynamic KPI cards (Sales, Profit, Growth), time-based trend analysis, and detailed breakdowns of product performance and regional sales distribution. Advanced calculations using DAX were implemented to measure profitability, growth rates, and performance comparisons, while Power Query was used for efficient data cleaning and transformation.
The goal of this project was not just to visualize data, but to present meaningful insights in a clean, user-friendly format that helps businesses understand performance and take informed actions.
0
2
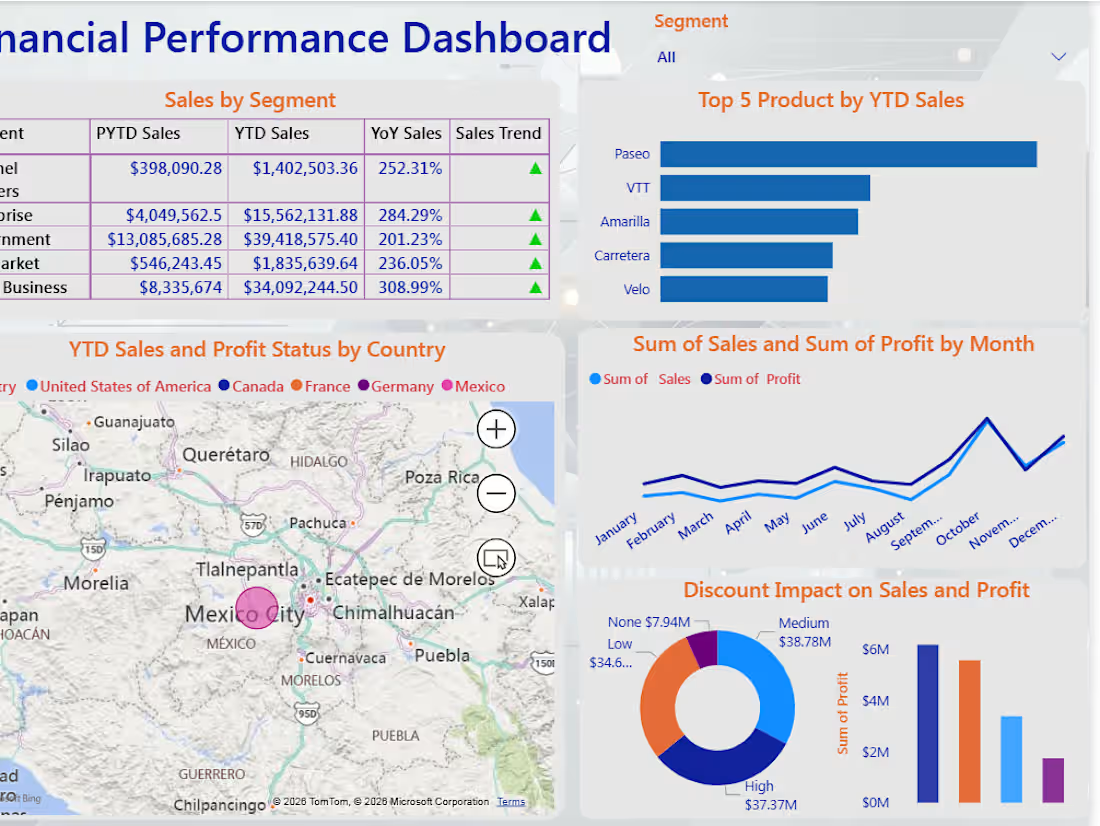
📊 Project Showcase: E-Commerce Sales Analytics Dashboard
I recently designed an interactive sales analytics dashboard using Microsoft Power BI to transform raw sales data into meaningful business insights.
Key Metrics
• Total Sales: $11.53M
• Total Profit: $1.34M
• Profit Margin: 11.58%
• Profit Target Achieved: 52%
Dashboard Capabilities
✔ Sales performance tracking (YTD)
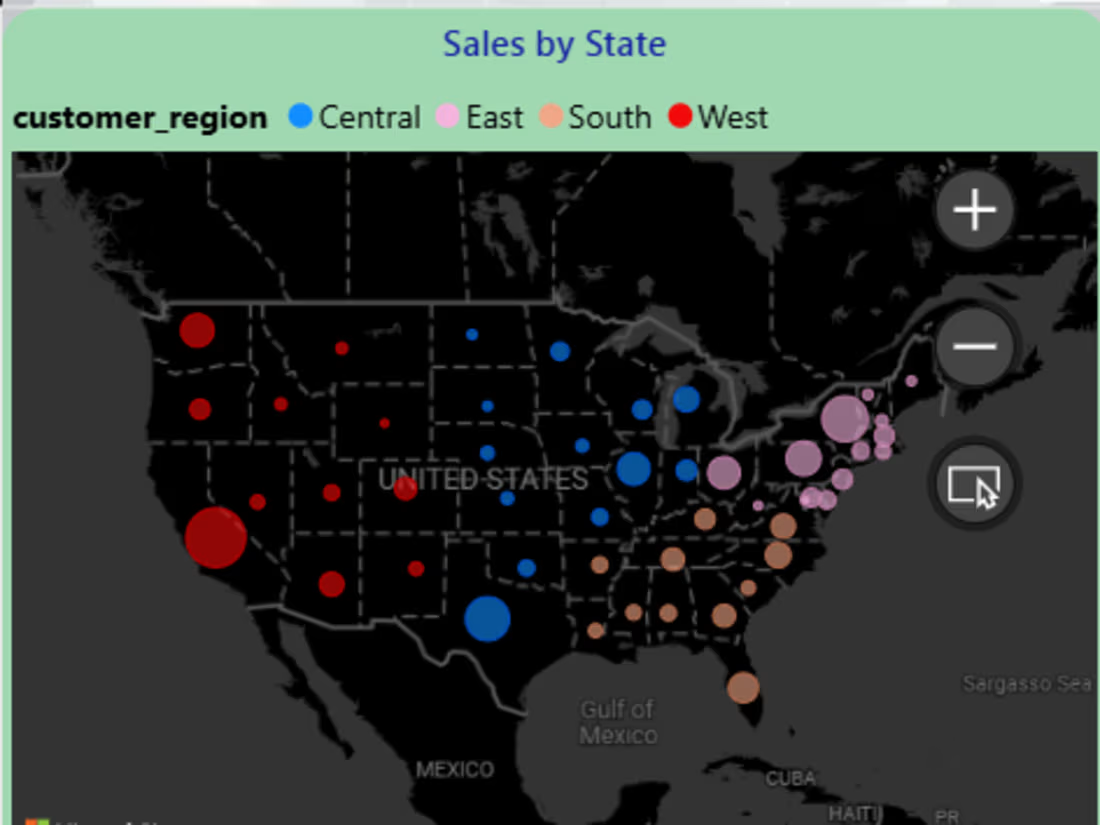
✔ Regional and category analysis
✔ Top & bottom product insights
✔ Interactive filtering for customer segments
✔ KPI tracking using DAX measures
This dashboard helps businesses monitor performance, identify trends, and support data-driven decisions.
💼 I’m currently available for projects involving:
• Power BI dashboards
• Data visualization
• Business analytics reporting
If you need a custom dashboard for your business data, feel free to reach out.
0
21

I’m pleased to share that I have successfully completed the Data Analysis Using Python course from IBM Skills Network.
This program strengthened my understanding of the data analysis workflow—from collecting and preparing data to performing exploratory analysis, creating meaningful visualizations, Model Development, Model Evaluation and Refinement.
where I practice:
Data cleaning and preprocessing with Python
Exploratory Data Analysis (EDA)
Data manipulation using Pandas
Data visualization for insight generation
Develop three model (Linear Regression, Multiple Linear and Polynomial Regression)
Evaluate and refine these models.
Certificate, badge and GitHub repository attached. Link: https://lnkd.in/gD9CB5d7
0
56
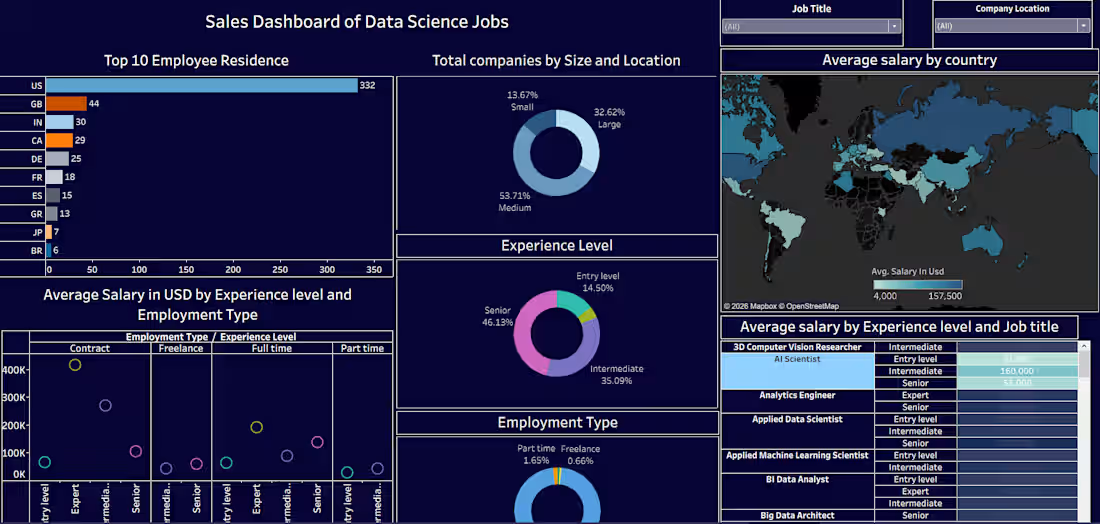
Exploring the Global Data Science Job Market through an interactive Tableau dashboard 📊
I recently built this dashboard to understand how salaries, experience levels, employment types, and company locations connect across the data science field worldwide.
Here’s what this dashboard highlights:
• Top countries where data professionals are based
• Average salary patterns by country and experience level
• Job distribution from entry level to expert
• Company size trends across different locations
• Salary comparison by job title and employment type
This project helped me practice data cleaning, visualization design, and storytelling with data. It also shows how interactive dashboards can quickly reveal trends that are hard to spot in raw tables.
Tableau public Link: https://lnkd.in/gdkgmEz3
0
66