
Ajay Thakur
Power BI Dashboard Expert | SQL | Data Visualization
New to Contra
Ajay is building their profile!

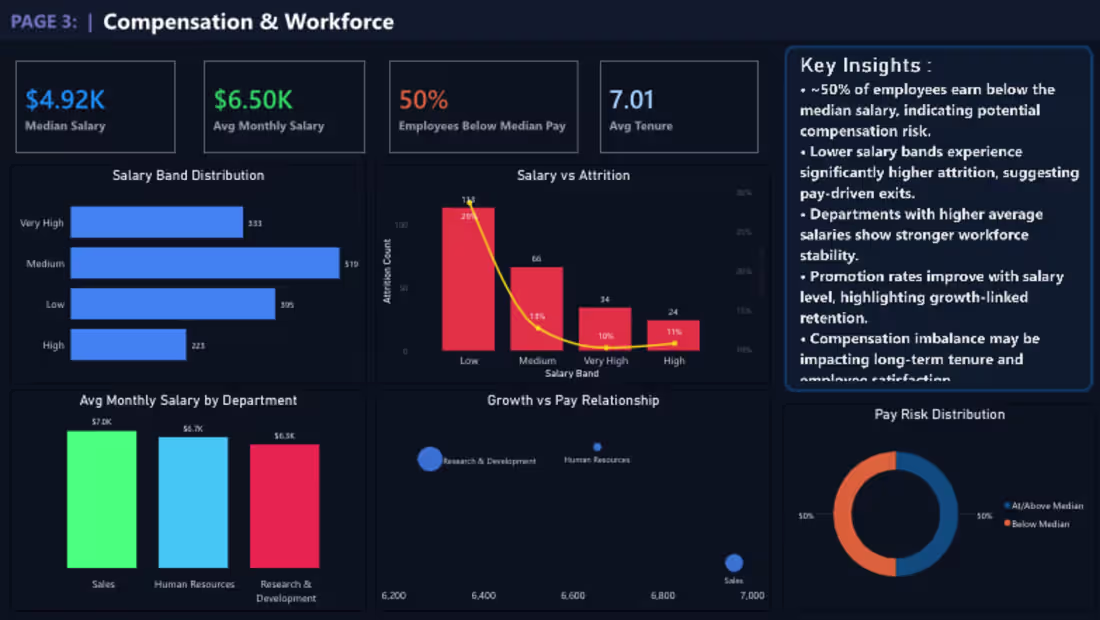
Built an HR Analytics Dashboard to analyze employee data and workforce trends.
Key features:
• Employee count & attrition analysis
• Department-wise performance
• Gender and age distribution
• Salary insights
• Interactive filtering for deep analysis
Tools used:
Power BI, Excel, DAX
Helps HR teams improve employee retention and workforce planning.
0
16
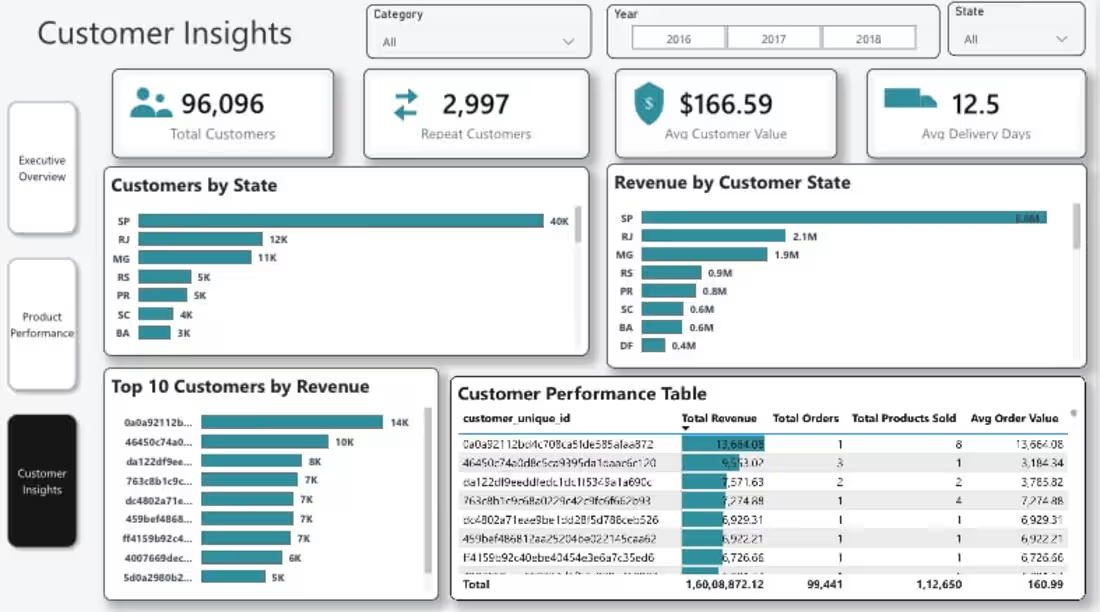
Performed end-to-end e-commerce data analysis using SQL and Power BI.
Key features:
• SQL data extraction and transformation
• Sales & customer behavior analysis
• Product performance tracking
• Revenue trends and insights
• Interactive Power BI dashboard
Tools used:
SQL, Power BI, Excel
This project helps businesses optimize sales strategies and customer insights.
0
15
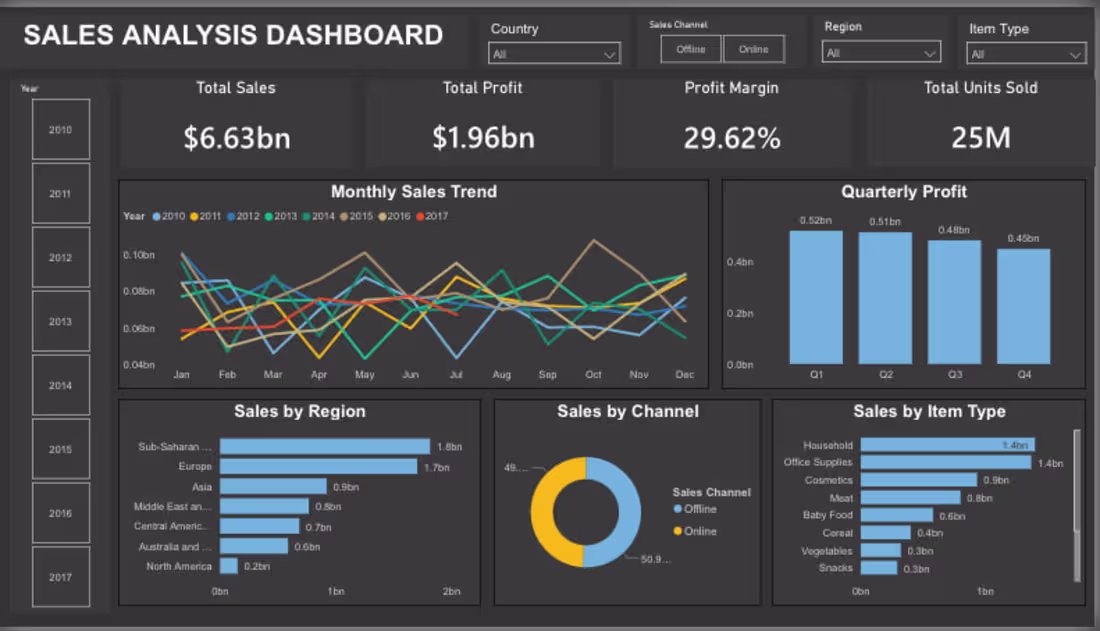
Developed a professional Sales Performance Dashboard to track revenue, profit, and growth trends.
Key features:
• KPI cards (Total Sales, Profit, Profit Margin)
• Monthly sales trend analysis
• Category & region performance
• Top products analysis
• Interactive filters & slicers
Tools used:
Power BI, Excel, DAX
This dashboard helps businesses monitor performance and make data-driven decisions.
0
20
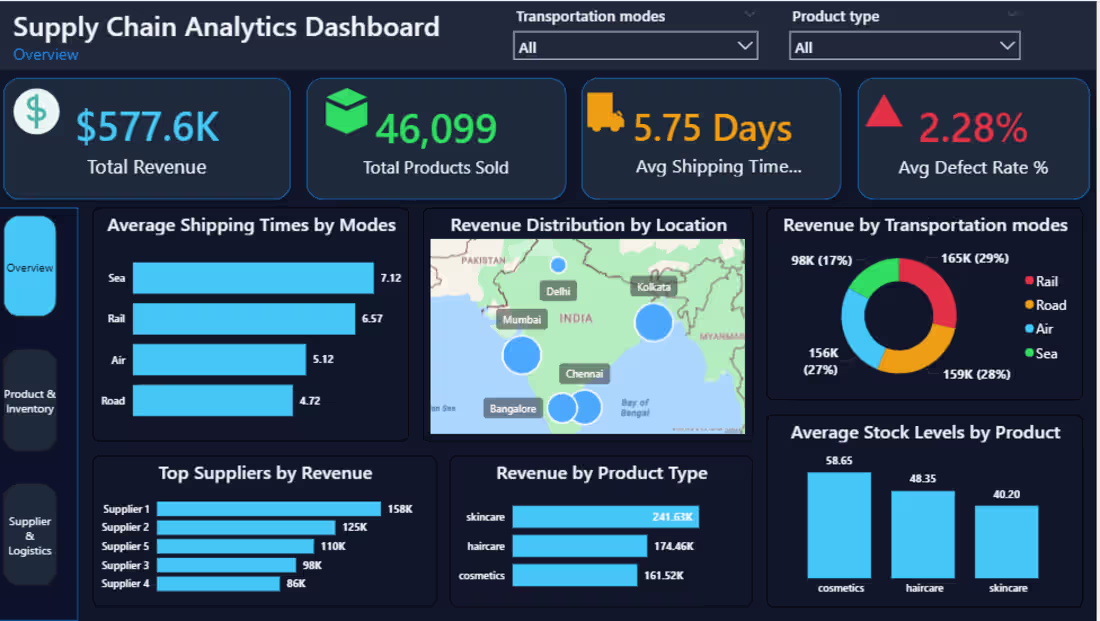
I developed a complete Supply Chain Analytics Dashboard using Power BI and SQL to analyze product performance, supplier efficiency, and logistics operations.
The dashboard includes 3 interactive pages:
• Overview – KPIs, revenue trends, and transportation insights
• Product & Inventory – demand vs stock, defect rate, product performance
• Supplier & Logistics – supplier efficiency, cost vs delivery analysis, risk insights
I used Power Query for data cleaning, DAX for KPIs, and SQL for data analysis.
This project helps businesses optimize supply chain decisions, reduce costs, and improve operational efficiency.
0
35