
pro
Agustín Alexis Miño Duro
Excel Expert & Business Admin Support
New to Contra
Agustín Alexis is ready for their next project!

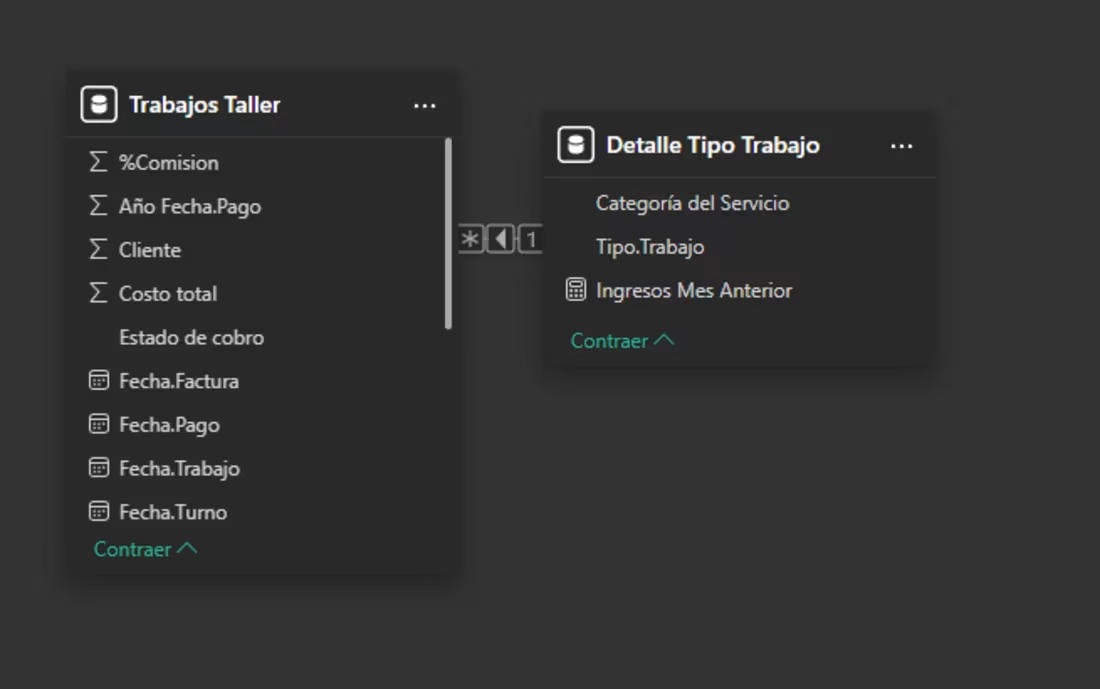
Relational Data Architecture for Automotive Service Operations
Project Overview
I engineered a custom relational data model to integrate and streamline the operational and financial data of a high-volume automotive service center. By transitioning from flat files to a structured Star Schema, I enabled complex time-intelligence analysis and improved the accuracy of financial reporting for the entire organization.
Key Features & Technical Implementation:
Relational Schema Design: Established a "One-to-Many" (*) relationship between operational tasks (Fact Table) and service categorizations (Dimension Table), ensuring data integrity and reducing redundancy.
Financial Data Governance: Mapped critical date fields—including Invoice, Payment, Work, and Appointment dates—to allow for precise tracking of the collection cycle and cash flow timing.
Advanced DAX Calculations: Implemented Time-Intelligence measures, such as "Previous Month Revenue" (Ingresos Mes Anterior), to provide real-time month-over-month growth comparisons.
Operational Categorization: Structured a hierarchical service classification system (Category vs. Job Type) to identify the most profitable labor segments and resource allocation.
Tools Used:
Power BI Data Modeling: For architecting the relational schema and managing cross-filter directions.
DAX (Data Analysis Expressions): For creating custom financial metrics and period-over-period comparisons.
Data Normalization: Transforming raw service logs into structured, relatable tables.
The Result:
This architecture serves as the "back-end" engine for all business intelligence at the facility. It allows the management team to drill down from high-level monthly revenue to specific job-type performance, drastically reducing the time spent on manual data reconciliation and enabling a more agile response to market demand.
1
11
Corporate Training Operations & Revenue Tracker
Project Overview
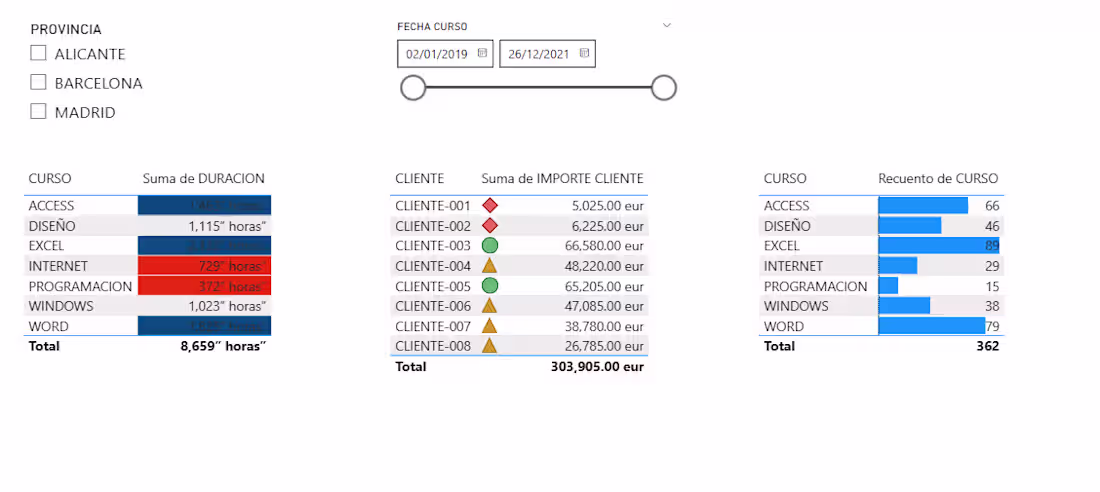
I designed a specialized operational dashboard to track and analyze the performance of corporate training programs. This tool provides high-level visibility into course demand, instructional hours, and client-specific revenue, allowing for strategic decisions based on historical performance data.
Key Features & Metrics Analyzed:
Resource Utilization Analysis: Aggregated and analyzed a total of 8,659 instructional hours across various technical programs (Excel, Word, Access, etc.) to monitor instructor workload.
Revenue Performance Monitoring: Tracked a total of 303,905.00 EUR in revenue, implementing a KPI status indicator (visual traffic light system) to evaluate the financial health of individual accounts.
Course Demand Metrics: Visualized a volume of 362 unique course sessions, identifying high-growth subjects like Excel (89 sessions) and Word (79 sessions) to guide future curriculum planning.
Temporal & Regional Slicing: Developed interactive filters to segment data by province (Madrid, Barcelona, Alicante) and specific date ranges (2019–2021) to detect seasonal trends.
Tools Used:
Power BI: UI/UX design and data visualization.
KPI Modeling: Applied conditional formatting and status icons to represent client profitability.
Data Aggregation: Used DAX to calculate sums and counts across disparate categories (Hours vs. Revenue).
The Result:
This dashboard enables training providers to identify their most profitable clients and popular courses at a glance. By correlating total hours with revenue per client, the business can optimize its ROI and allocate resources more effectively based on regional demand.
1
17
B2B Revenue & Billing Distribution Dashboard
Project Overview
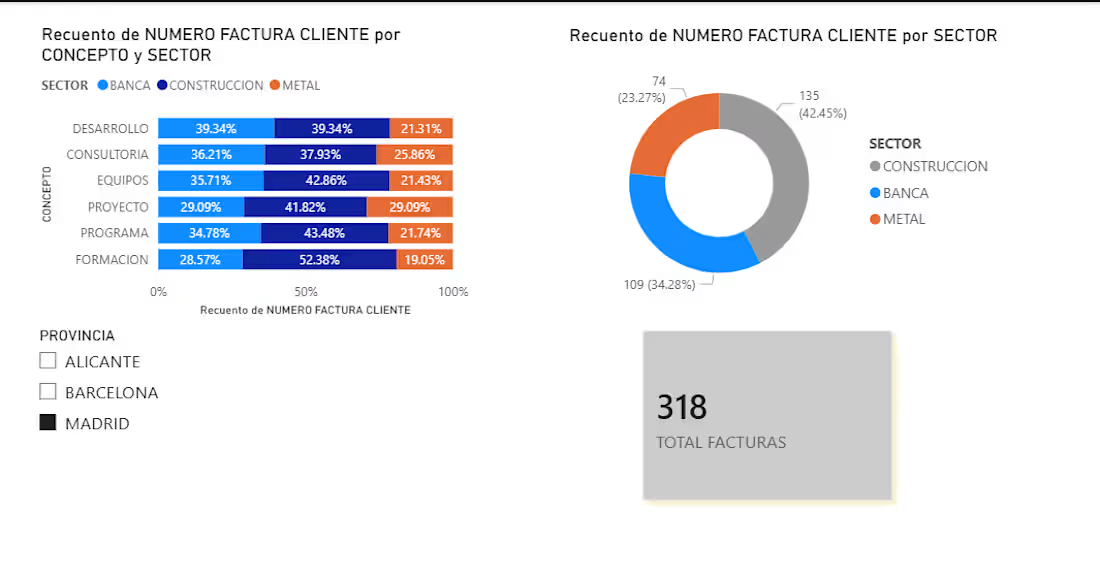
I developed a comprehensive data visualization tool to analyze billing distribution across multiple business sectors and service categories. The goal was to transform raw invoice data into actionable insights, allowing for a clear understanding of which business segments drive the highest volume of operations.
Key Features & Metrics Analyzed:
Total Volume Analysis: Processed and visualized a dataset of 318 unique invoices to identify overall business activity.
Sector Segmentation: Created a detailed breakdown of operations by industry, identifying Construction (42.45%) and Banking (34.28%) as the primary revenue drivers.
Service Concept Deep-Dive: Implemented a stacked bar analysis to correlate service types (Consulting, Development, Training) with specific industry sectors.
Geographic Filtering: Integrated dynamic slicers for regional analysis (Madrid, Barcelona, Alicante) to monitor performance across different provinces.
Tools Used:
Power BI: For interactive dashboarding and data storytelling.
Power Query: For data cleaning and transformation of the billing dataset.
DAX: To calculate percentage distributions and custom count metrics.
The Result:
This dashboard provides a "single source of truth" for financial operations, enabling managers to see exactly where resources are being allocated and which service lines (like "Formation" or "Consulting") are most profitable in specific regions.
0
13
Financial & Operational Power BI Dashboard for SME
My role: Business Analyst & Power BI Developer
Project description:
Developed a Power BI dashboard for an automotive SME, transforming manual data into a financial and operational control system.
I modeled data with Power Query and built DAX measures for Net Profit Margins, Average Ticket, and Accounts Receivable.
This gave management real-time insights to track profitability and accelerate collections.
0
23