
abderrahim barki
Data Entry & Virtual Assistant helping you save time
New to Contra
abderrahim is ready for their next project!

Hi everyone 👋
I’m currently starting my journey as a Data Entry & Data Analysis specialist.
I can help with:
• Data entry (Excel / Google Sheets)
• Data cleaning & organization
• Simple dashboards & reports
I’m looking for opportunities to work with clients and gain real experience.
I’m offering a free sample task to show the quality of my work before any commitment.
If you need help with your data, feel free to reach out! 🚀
1
3
347
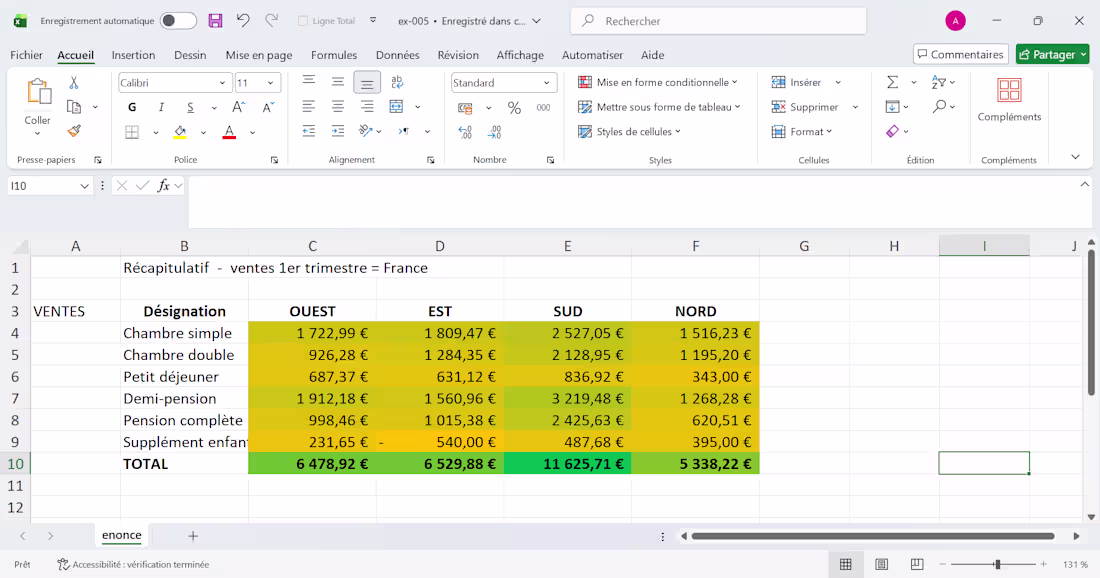
I created a sales report in Microsoft Excel analyzing first quarter sales performance across different regions in France.
In this project, I organized and structured sales data by product and region (West, East, South, North), and calculated totals for each category.
I applied formatting and summarization techniques to make the data clear, readable, and useful for business decision-making.
This type of work is useful for tracking performance and identifying trends across different regions.
Tools used: Microsoft Excel
0
27
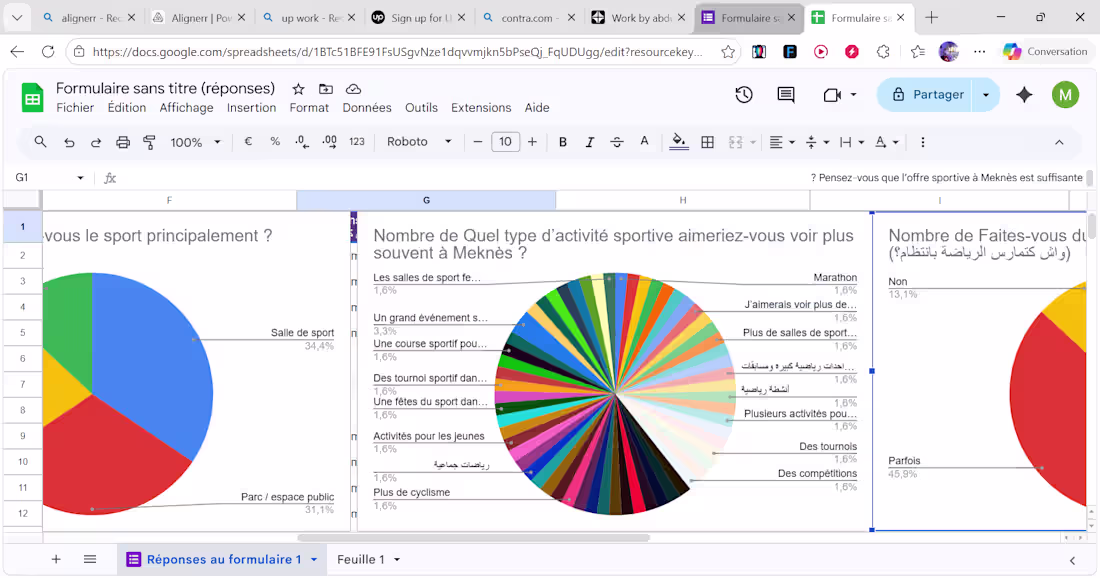
I created a data analysis dashboard using Google Sheets based on a sports survey.
In this project, I collected and analyzed responses related to sports habits, including preferred locations, activity types, and frequency of ممارسة الرياضة.
I built visual dashboards using charts to make the data easy to understand and highlight key insights.
This type of work helps businesses and organizations make data-driven decisions and understand user behavior.
Tools used: Google Sheets, Data Visualization
0
31
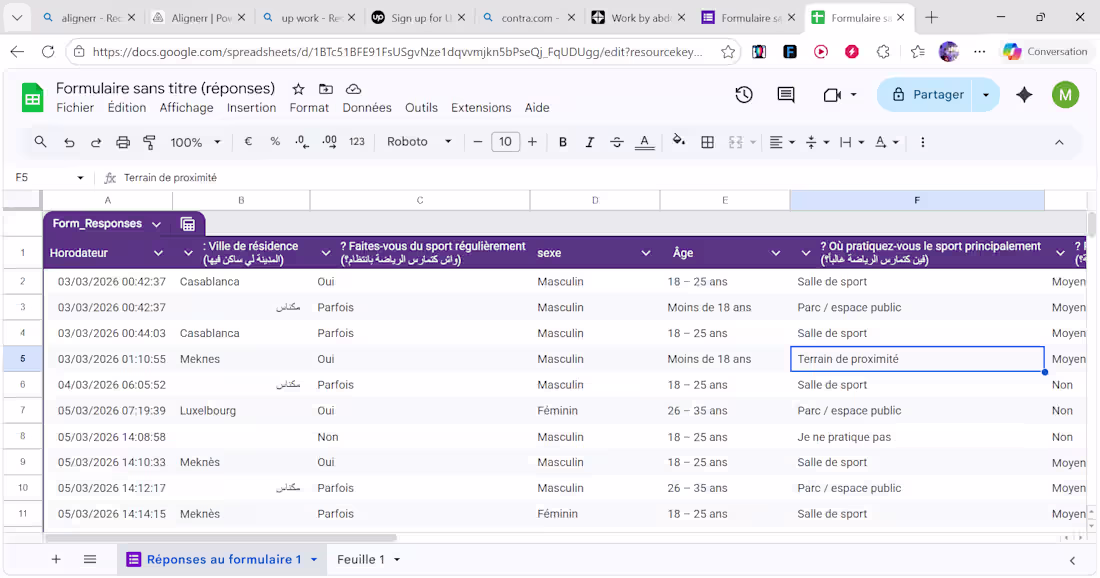
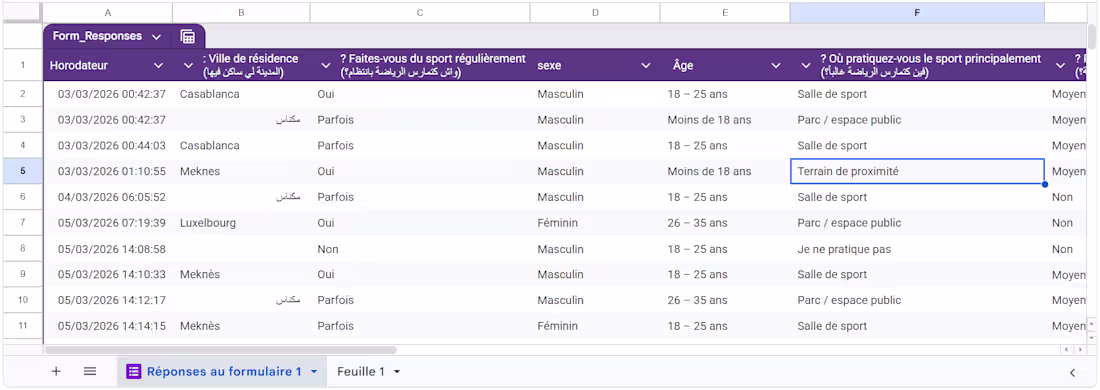
I created a survey data analysis project using Google Sheets.
In this project, I collected and organized responses from a sports-related survey, including data such as city, age, gender, and sports habits.
I cleaned the data, structured it properly, and made it easy to analyze.
This type of work helps businesses and organizations understand user behavior and make better decisions based on data.
Tools used: Google Sheets
0
38
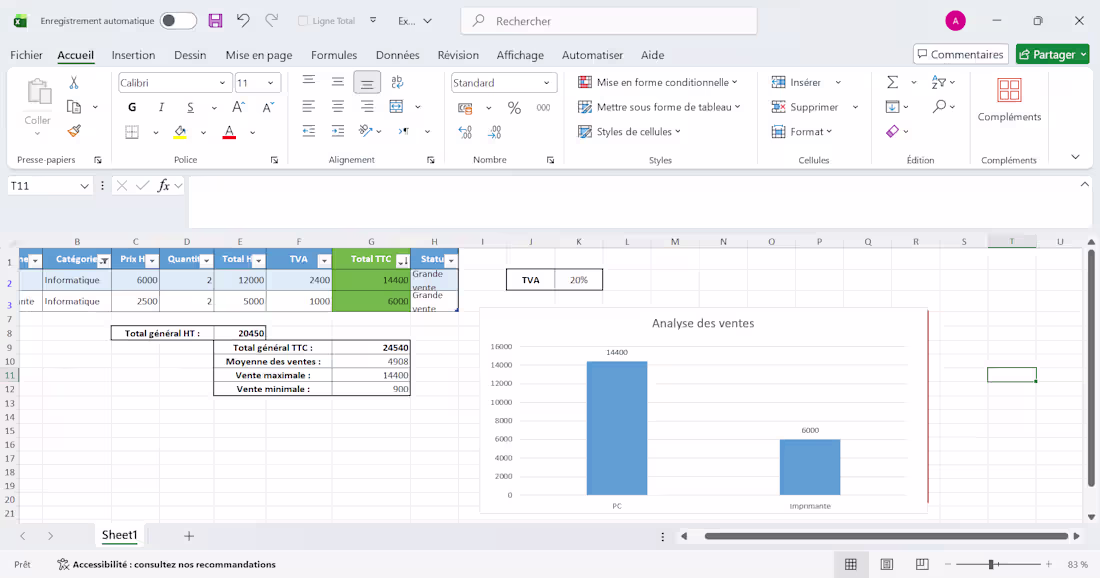
Sales Analysis Dashboard (Excel)
Created a simple and clean Excel dashboard to analyze sales data.
This project includes:
Automatic calculations (Total HT, TVA, Total TTC)
Sales summary (average, max, min)
Data organization and formatting
Visual chart for better insights
This type of work helps businesses understand their performance quickly and make better decisions.
0
29