
Abdelfattah Mohamed
Data Platform & Observability Engineer | DataOps & Cloud
New to Contra
Abdelfattah is ready for their next project!
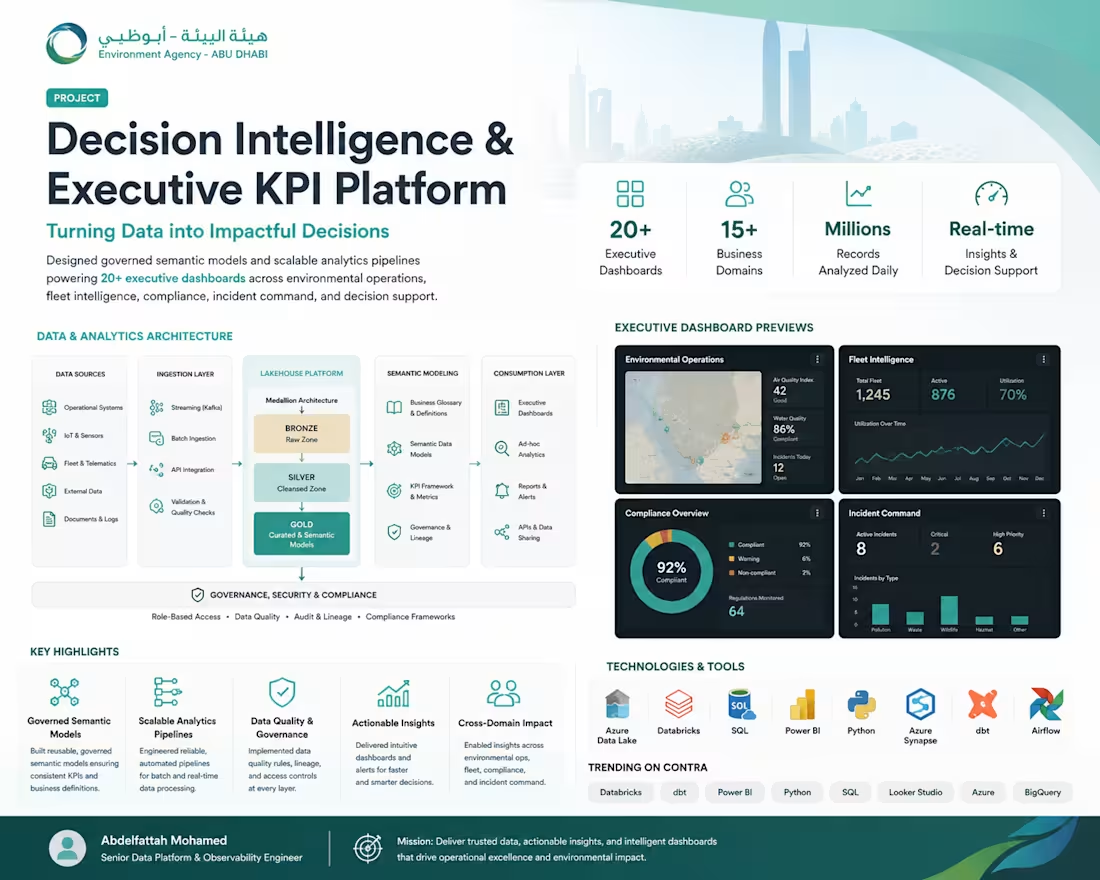
Delivered as a Senior Data Platform Consultant through Pixonal for Environment Agency – Abu Dhabi, this project focused on building a governed decision-intelligence foundation for executive and operational reporting.
I designed governed semantic data models and scalable analytics pipelines that transformed complex operational data and stakeholder requirements into consistent, reusable business metrics. The work included KPI governance, reporting standards, semantic modeling, analytics architecture, and the enablement of AI-assisted reporting and operational insight delivery.
The solution supported more than 20 executive dashboards across key environmental and operational domains, including Air Quality, Fleet Intelligence, Compliance, Illegal Dumping Detection, Incident Command Center, and related decision-support use cases.
My contribution included gathering and translating stakeholder requirements, defining reusable KPI structures, designing semantic data models, establishing scalable analytics pipelines, and creating reporting standards that improved the consistency and reliability of executive insights.
The platform helped leadership and operational teams gain clearer visibility into environmental indicators, operational performance, incidents, compliance measures, and cross-domain KPIs. It demonstrates my ability to connect business objectives with technical data architecture and turn complex data into trusted, decision-ready insights.
Key capabilities demonstrated: Decision Intelligence, Data Analytics, Semantic Data Modeling, KPI Governance, Data Governance, Analytics Engineering, Executive Dashboards, Requirements Analysis, and Operational Reporting.😍
0
0
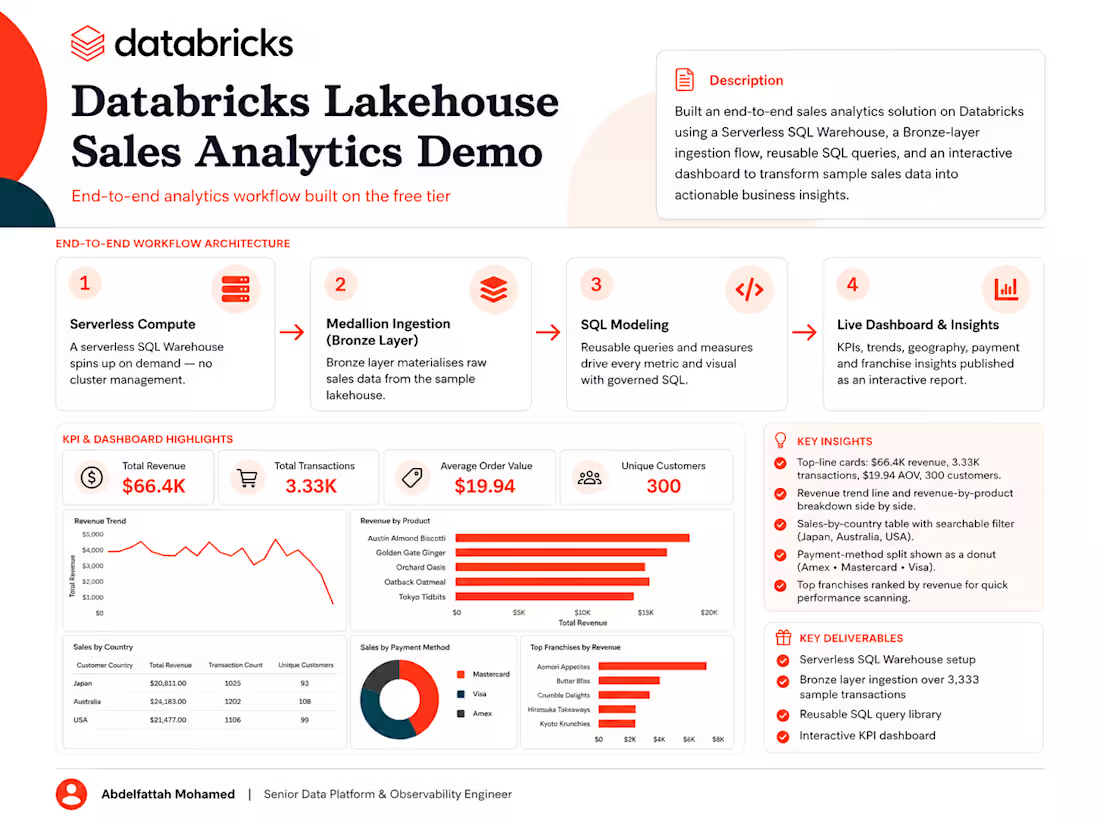
🧠Built an end-to-end Databricks Lakehouse Sales Analytics demo that transforms raw sales transactions into clear, decision-ready business insights.
I configured an on-demand Serverless SQL Warehouse, ingested the Databricks sample sales dataset into a Bronze-layer table, developed reusable SQL queries and measures, and published an interactive analytics dashboard. The workflow demonstrates the complete journey from raw data ingestion to business reporting using a practical Lakehouse and Medallion Architecture approach💯
The demo analyzes 3,333 sample transactions across multiple countries, products, payment methods, customers, and franchises. The dashboard presents headline KPIs including $66.4K in revenue, 3.33K transactions, a $19.94 average order value, and 300 unique customers, together with revenue trends, product performance, country analysis, payment-method distribution, and top-franchise rankings.
I also used Databricks Query History to track SQL execution status, duration, and source across 64 query executions, providing visibility into the development and analytical workflow.
This project demonstrates my capabilities in Databricks, Lakehouse Architecture, Serverless SQL, Medallion Architecture, SQL modeling, data ingestion, KPI development, dashboard design, and business analytics.
The project was prepared as a technical demonstration using Databricks sample data and was delivered entirely on the free tier—without exposing any production or confidential client information.
Tools and technologies: Databricks Lakehouse, Serverless SQL Warehouse, SQL, Bronze Layer, Medallion Architecture, Databricks Dashboards, Data Modeling, KPI Reporting, and Data Visualization🙌 🎉
0
0
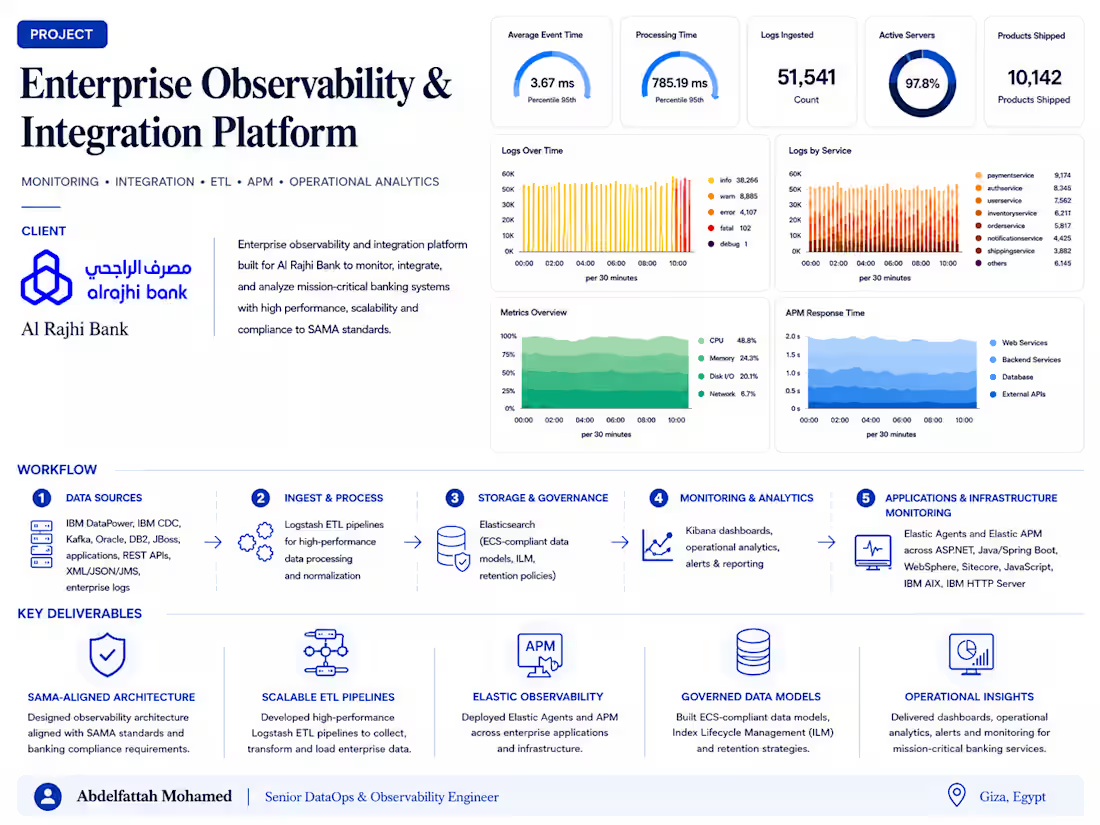
Enterprise observability and integration platform delivered for Al Rajhi Bank, covering centralized logging, ETL pipelines, APM, infrastructure monitoring, dashboards, and operational analytics.
I designed the architecture, integrated complex banking systems, deployed Elastic monitoring across enterprise applications, and built governed data models and lifecycle strategies aligned with banking compliance requirements😍
1
1
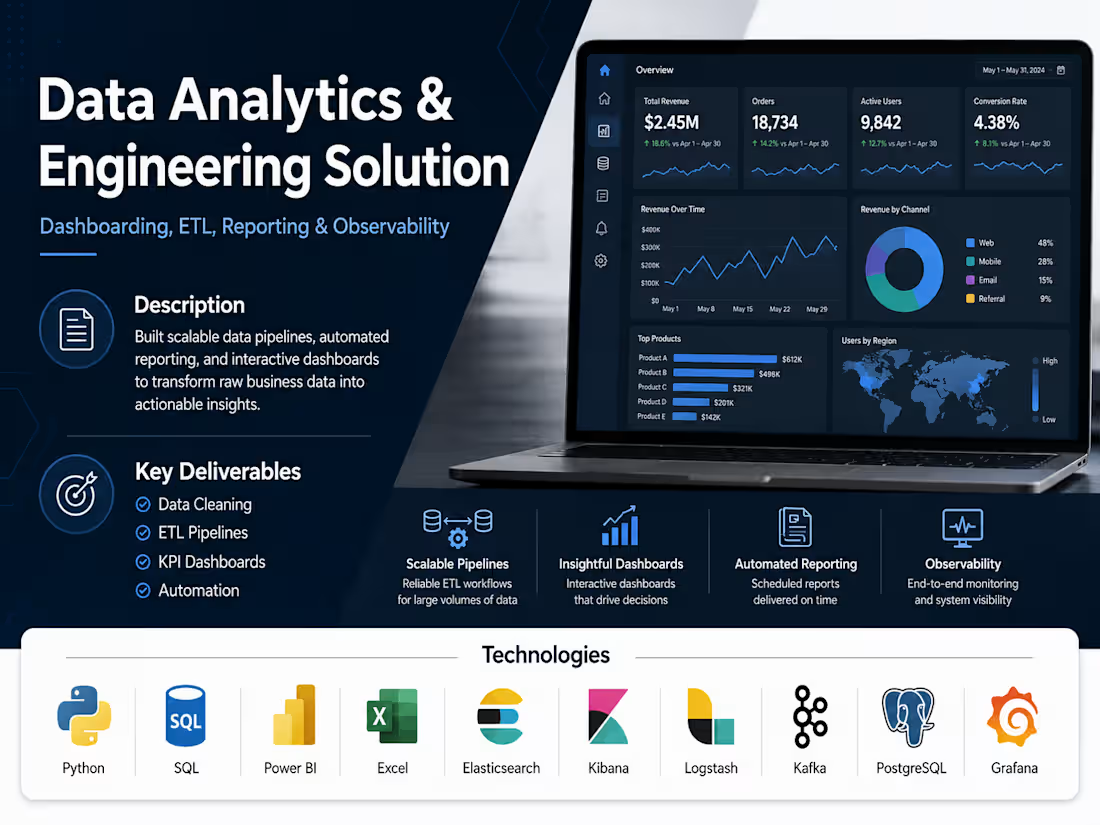
I designed a complete Data Analytics and Engineering solution that transforms raw business data into clear, actionable insights.
The work includes data cleaning, ETL pipeline development, KPI dashboard design, automated reporting, and observability.
Technologies used: Python, SQL, Power BI, Excel, Elasticsearch, Kibana, Logstash, Kafka, PostgreSQL, and Grafana.
0
0