
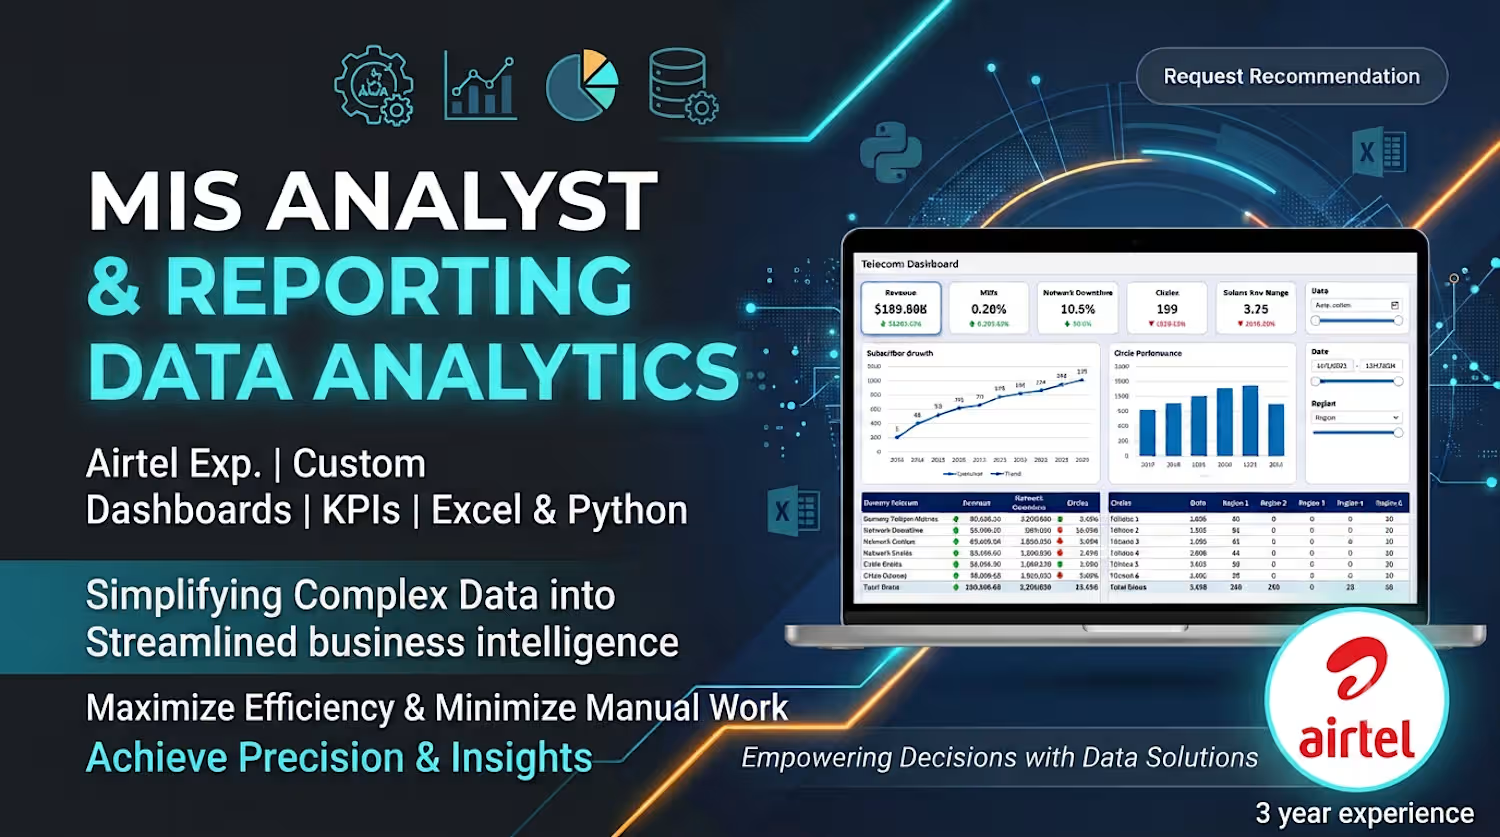
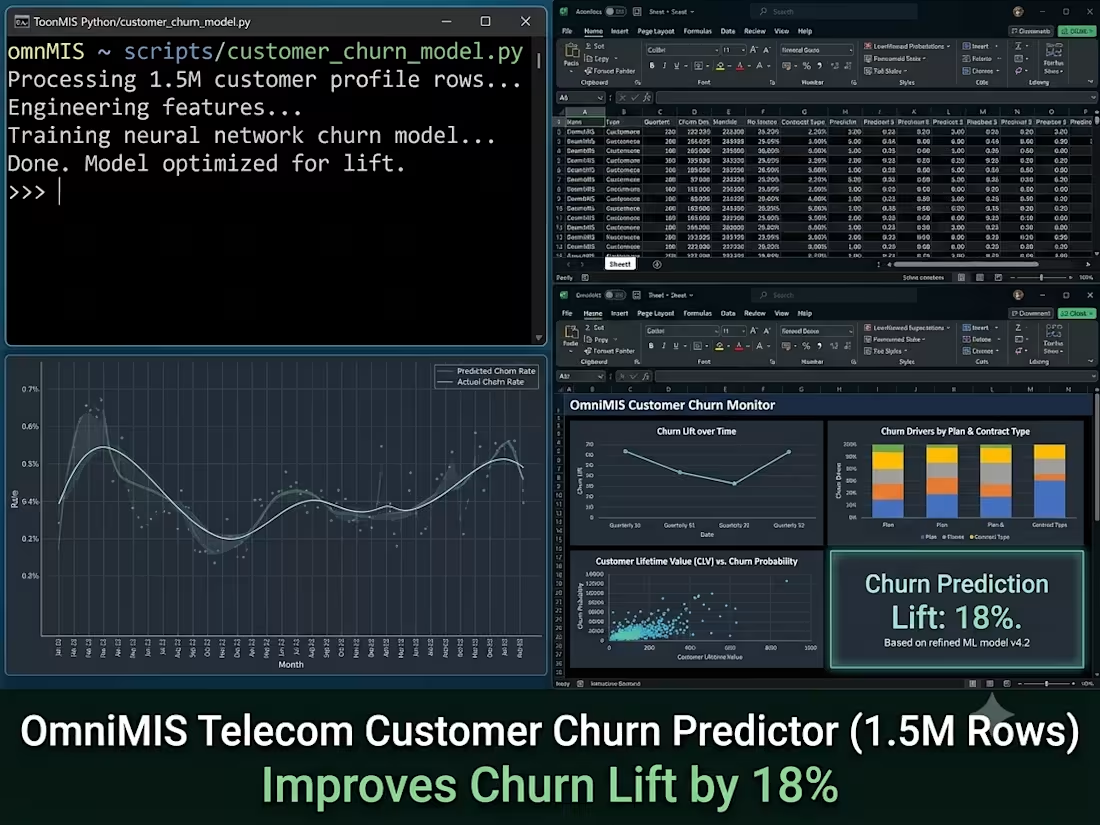
Large-Scale Time-Series Trend & Anomaly Tracker (1M+ Rows)
Project Description
Project Title: High-Volume Telecom Network Anomaly & Trend Tracker (1M+ Rows)
The Challenge: Analyzing long-term network downtime and subscriber trend data across millions of rows was exceeding Excel's memory limits, causing frequent crashes.
The Solution (Python Pandas + Streamlit/Excel): Processed 1M+ rows using Python’s optimized memory management to detect downtime anomalies and churn trends. The aggregated, lightweight summary was then exported directly to an interactive Excel Pivot & Dynamic Chart interface.
The Impact: Enabled seamless analysis of 1M+ row datasets without memory overhead, detecting 15% more network downtime spikes proactively.
0
7
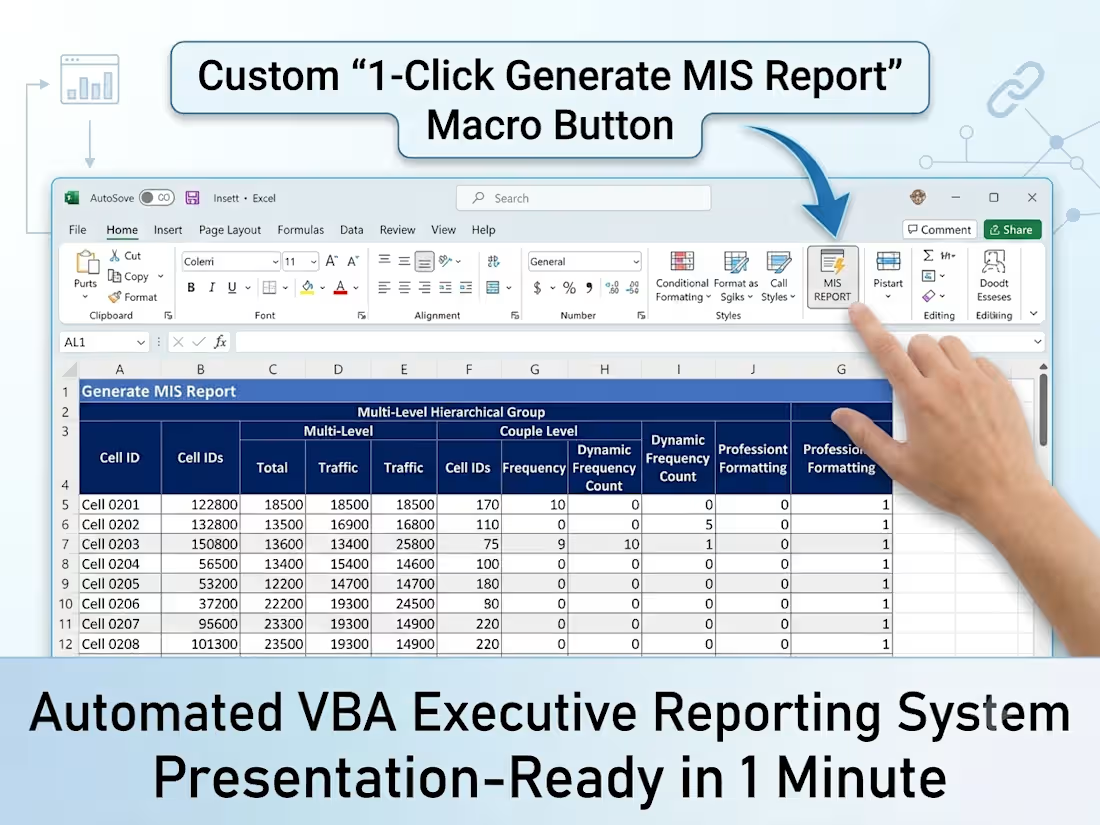
Automated VBA & Power Query Executive Reporting System
Project Description
Project Title: Executive MIS Reporting Engine with Automated Multi-Level Headers
The Challenge: Building custom board-level reports required complex multi-level nested headers, conditional frequency calculations (e.g., Circle-wise issue counts), and repetitive formatting every week.
The Solution (VBA + Advanced Excel): Created a custom 1-click VBA Macro embedded in Excel that extracts data via Power Query, automatically generates hierarchical two-tier headers, inserts dynamic frequency columns at specific positions, and formats tables into presentation-ready layouts.
The Impact: Generated board-ready reports in under 1 minute instead of 2.5 hours, allowing leadership to make faster data-driven decisions.
0
12
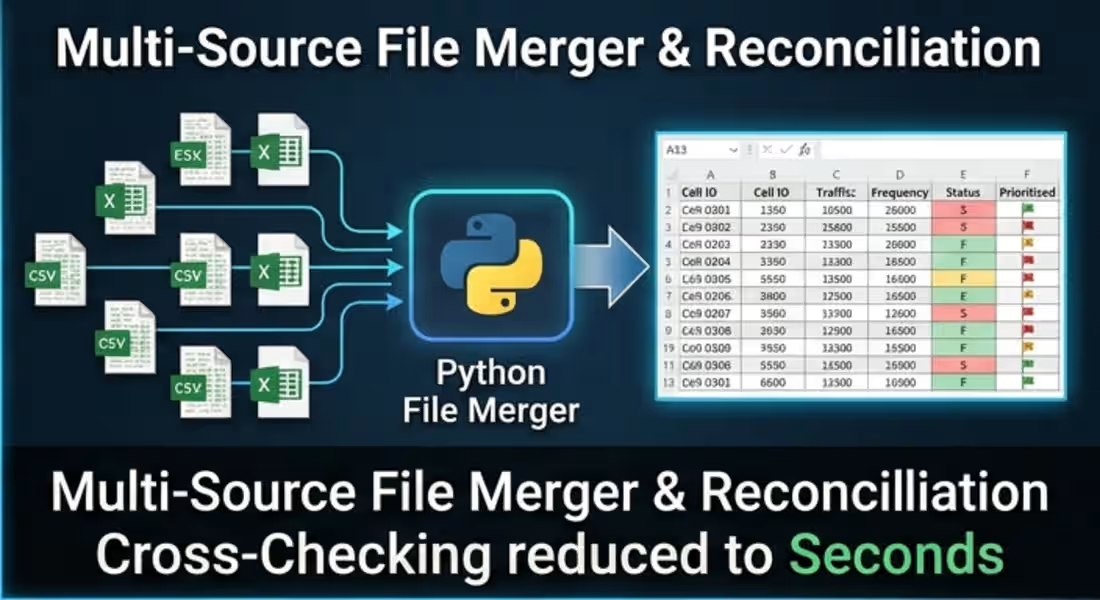
Automated Multi-Source File Merger & Reconciliation Tool
Project Description
Project Title: Multi-Source Excel Data Consolidation & Discrepancy Finder
The Challenge: Daily reconciliation across 20+ regional files with different column naming structures and messy formatting was causing delays and missing records.
The Solution (Python + Power Query): Engineered a unified pipeline where a Python script uses Fuzzy Logic & Pandas to standardize column headers, deduplicate records, and automatically reconcile mismatched totals into a clean Excel output.
The Impact: Reduced 3 hours of daily manual cross-checking to 10 seconds with zero human error.
0
9
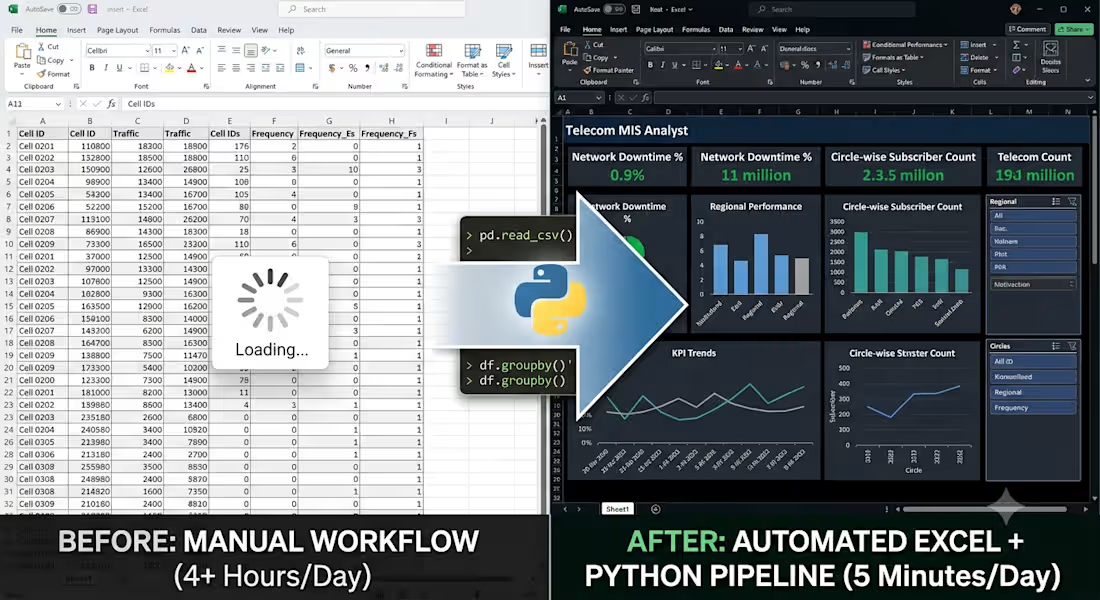
Project Title: Telecom Network KPI Reporting Automation: Advanced Excel & Python Data Pipeline
This project showcases an end-to-end reporting automation solution combining the processing power of Python (Pandas) with the familiar user interface of Advanced Excel. As an MIS Analyst (Airtel background), I developed this system to eliminate a critical bottleneck in the daily network performance reporting workflow.
0
21