
Somil Soni
Helping businesses make smarter decisions with data analysis
New to Contra
Somil is building their profile!

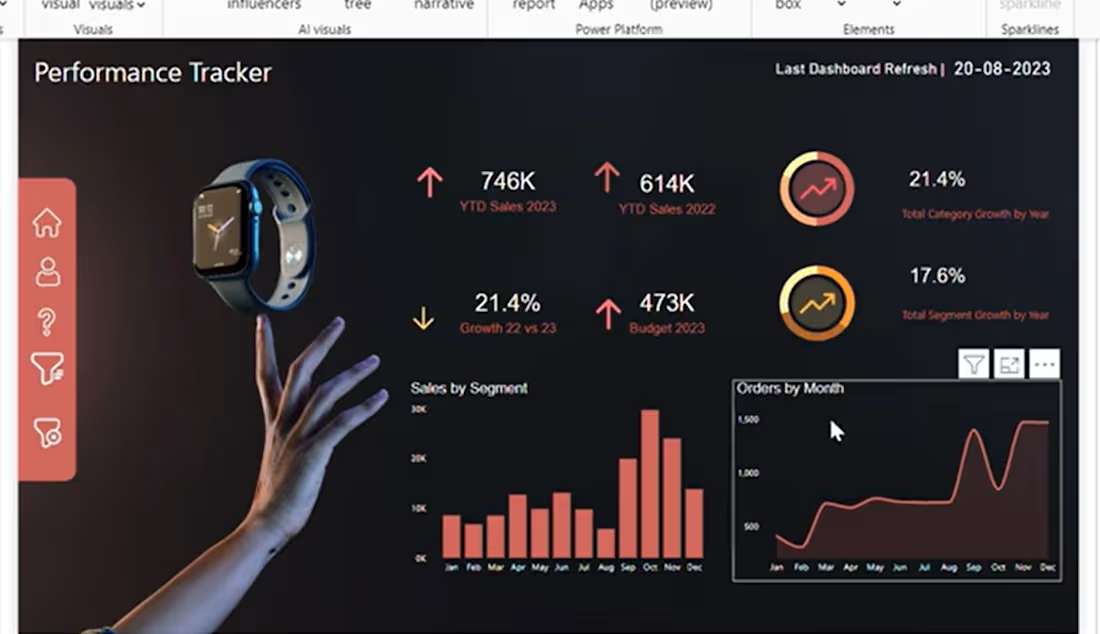
Designed a Sales Performance Tracker Dashboard in Power BI that provides real-time insights into revenue, profit, sales growth, top-performing products, customer segments, and regional performance. Implemented interactive filters, drill-through reports, KPI cards, and DAX calculations to support data-driven business decisions.
0
3
I created a Power BI dashboard for my marble
business entirely on my own, even without asking for any help. I learned how to import raw business data into Power BI and clean it using Power Query. I make important KPIs such as Total Revenue, Total Profit, Profit Margin %, Average Order, Top-Selling Marble Type, etc. Since I completed the project
independently, I strengthened my ability to research solutions and troubleshoot issues on my own. At last, I gained a deeper understanding of the marble business itself.
1
12