
Solomon Giwa
Data Analyst |Excel|Power BI & Insightful Data Visualization
New to Contra
Solomon is building their profile!
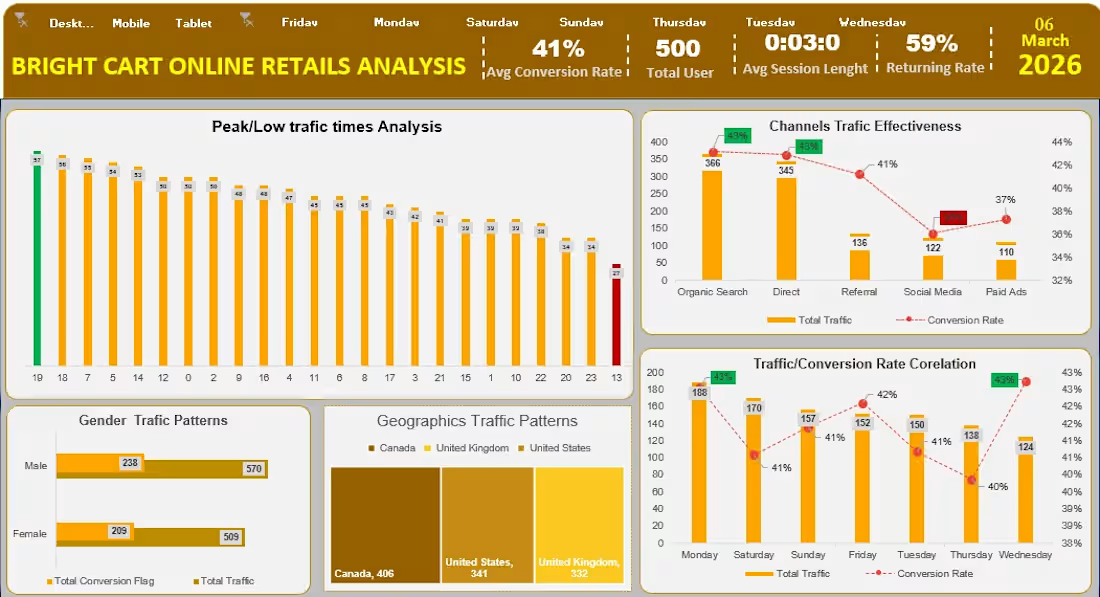
Bright Cart Online Retail Traffic Analysis Dashboard
This project analyzes website traffic behavior and conversion performance for an online retail platform called Bright Cart. It helps stakeholders optimize marketing strategies and improve return on investment (ROI).
Using Microsoft Excel and advanced analytics tools such as Power Query, Pivot Tables, Power Pivot and interactive dashboards, I developed a comprehensive visualization that highlights traffic patterns, marketing channel performance, and customer segmentation. The analysis identified peak and low traffic periods, enabling marketing teams to better schedule campaigns for maximum engagement. Traffic sources were evaluated to determine which channels drive the most valuable users.
Key Findings
The findings reveal the Organic Search and Direct Traffic to be the strongest acquisition channels, generating 366 and 345 users respectively, each with approximately 43% conversion rate. Wednesday shows the highest conversion rate (43%), indicating it is the most effective day for promotional campaigns. Social Media traffic shows lower performance, contributing 122 users with the lowest conversion rate (35%), suggesting the need for strategy improvement.
Also Male users generate slightly higher website traffic (570) compared to female users (509). Canada is the top geographic source of traffic (406 users), followed by the United States (341) and United Kingdom (332). Traffic analysis also reveals evening hours as peak engagement periods, while early afternoon periods experience the lowest traffic.
Tools Used: Microsoft Excel, Power Query, Pivot Tables, Power Pivot, Data Visualization & Dashboard Design
Business Value
The insights from this dashboard help stakeholders:
Schedule marketing campaigns during high-conversion periods
Allocate marketing budgets to high-performing channels
Improve underperforming traffic sources and
Develop targeted campaigns for key geographic markets
0
4