
Shikhar Singh
Data Analyst | Power BI & SQL Dashboard Expert
New to Contra
Shikhar is building their profile!

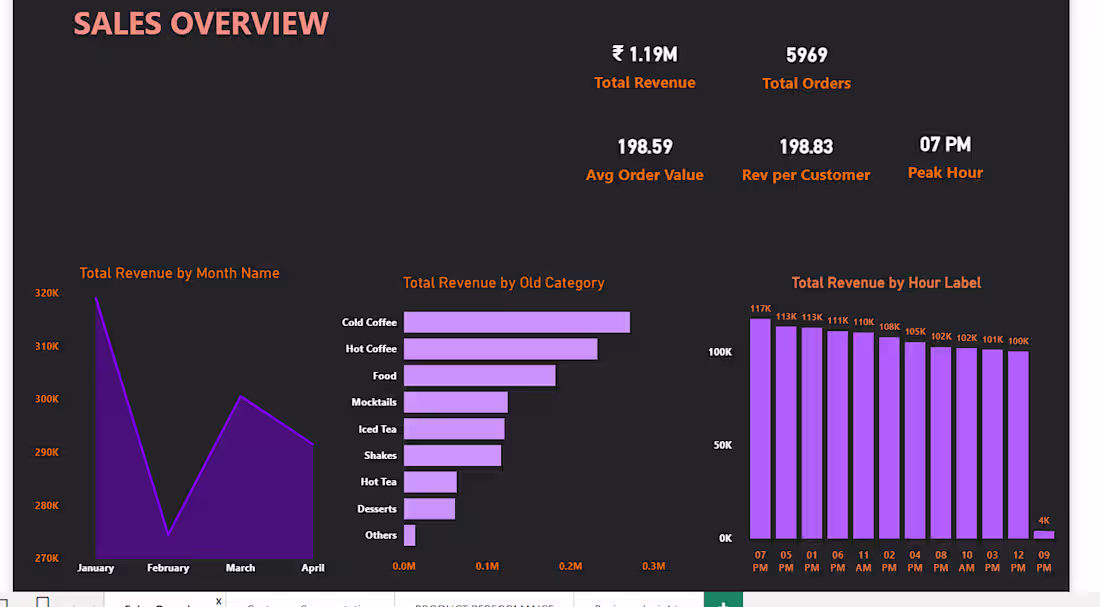
Developed an end-to-end Power BI dashboard for ABC Coffee to analyze sales performance, customer behavior, and product trends. The project involved data cleaning and transformation in Power Query, creation of dynamic DAX measures, and building interactive visualizations to generate actionable business insights. Key outcomes included identifying peak sales hours, top-performing products, customer segments, and recommending strategies to improve retention and revenue growth.
0
28
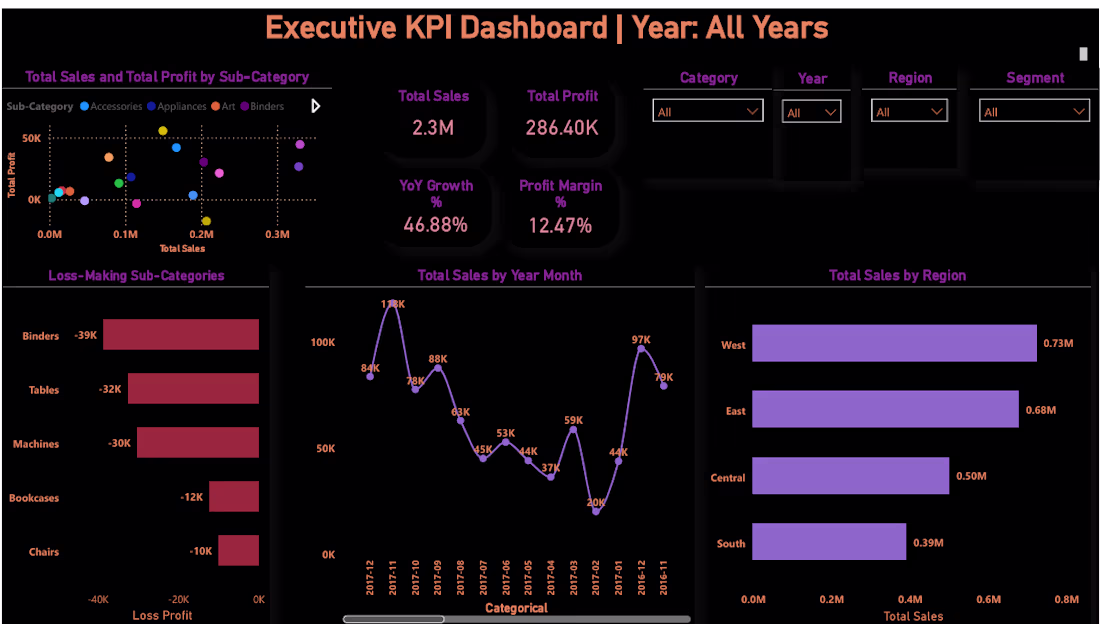
Executive KPI Dashboard (Power BI) — Developed an executive-level business intelligence dashboard using the Superstore dataset to monitor sales performance, profitability, and loss-making segments. Implemented star schema data modeling, Power Query transformations, and advanced DAX time intelligence to deliver interactive KPI tracking (Sales, Profit, YoY Growth, Margin), region-wise performance insights, and a Sales vs. Profit scatter analysis with dynamic filtering for leadership-ready decision support.
0
32