
Sakshi Raut
Data analyst turns raw data into insights for decisions.
New to Contra
Sakshi is building their profile!

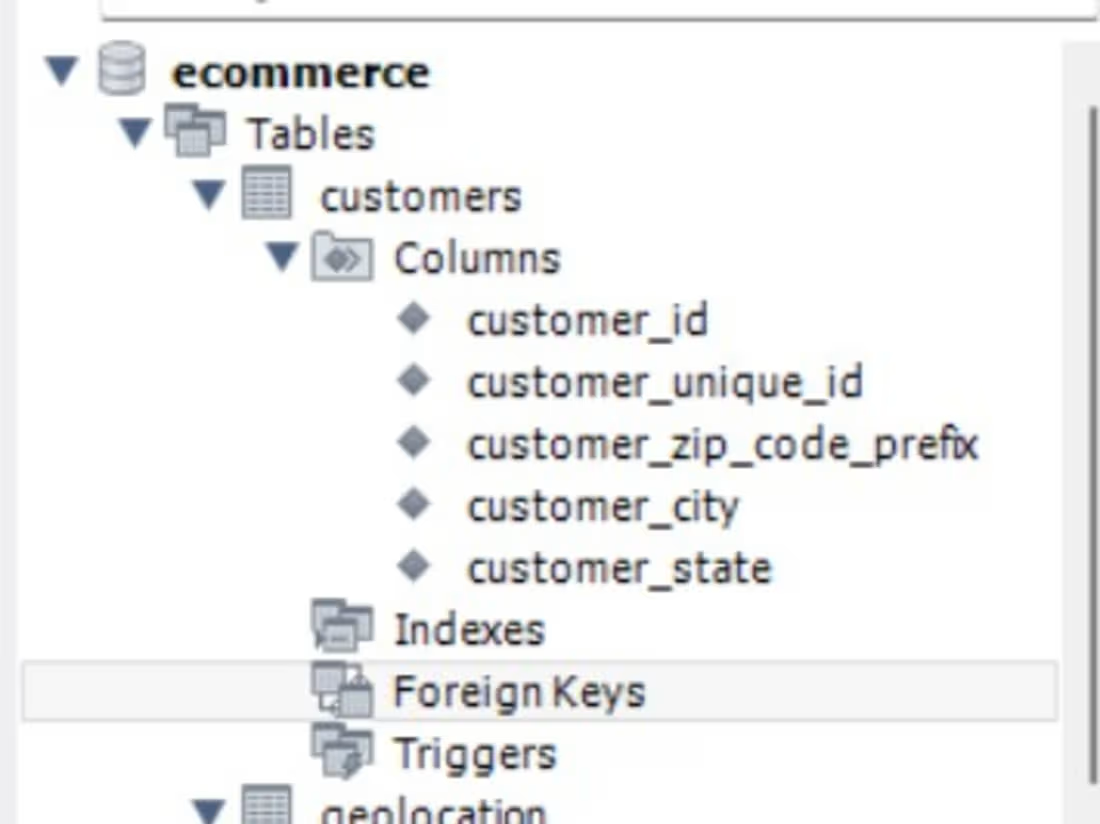
E-commerce Data Analysis with Python & MySQL
Analyzed an e-commerce dataset using Python, pandas, Seaborn, and MySQL to uncover customer behavior, sales trends, and product insights. Visualized key metrics like customer distribution by state and monthly order trends.
0
5
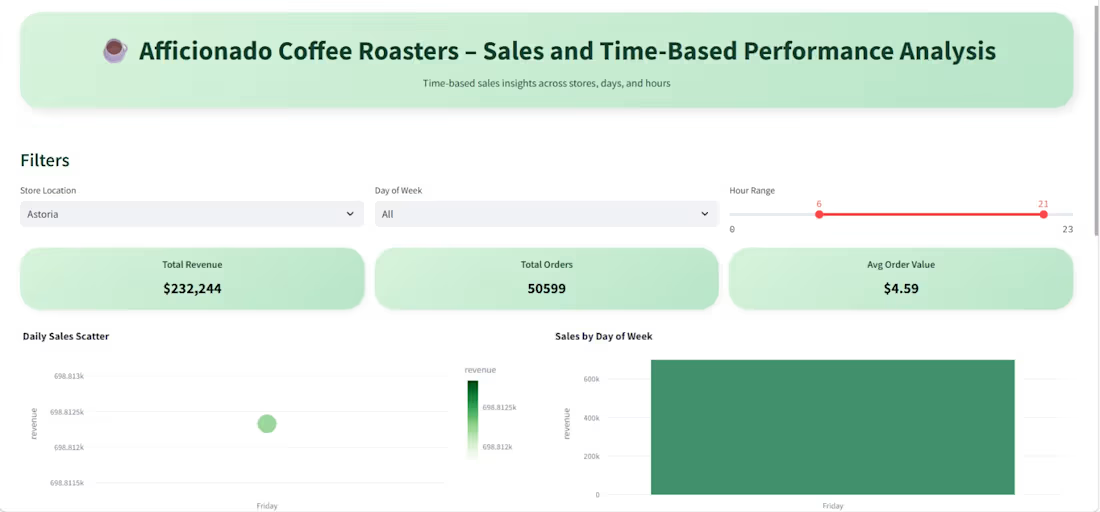
ficionado Coffee Roasters – Sales & Time-Based Performance Analysis
Developed an interactive dashboard using Python (Pandas, Plotly, Streamlit) to analyze transaction-level data and uncover sales patterns across time and store locations. Identified peak hours, day-wise trends, and product performance, and provided actionable recommendations to optimize staffing, operations, and revenue.
0
10

Weather Impact on Flight Operations – Power BI Dashboard
Data visualization project built using Power BI and Excel to analyze weather-related impacts on flight operations. Features dynamic slicers, KPIs, and trend analysis for better decision-making.
0
22