
Saifudeen PK
Data Analyst | Power BI, Excel, Tableau, SQL, Python
New to Contra
Saifudeen is building their profile!

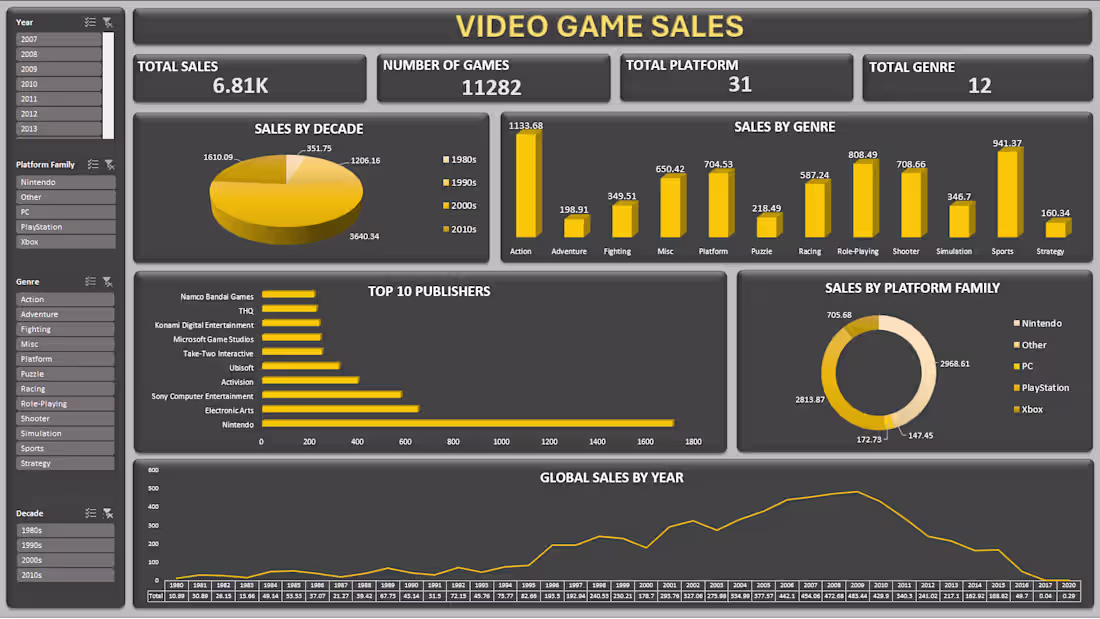
Built an interactive Excel dashboard to analyze global video game sales trends across platforms, genres, publishers, and decades.
This project focused on transforming raw sales data into meaningful business insights using data cleaning, aggregation, and visualization techniques.
Key Highlights:
• Cleaned and structured raw datasets for analysis and reporting
• Built Pivot Tables to analyze global and regional sales performance
• Designed an interactive dashboard using slicers for dynamic filtering
• Developed KPI cards to track Total Sales, Games, Platforms, and Genres
• Performed trend, comparative, and distribution analysis across multiple dimensions
Key Insights:
• Sports and Action genres dominated global sales
• Nintendo emerged as the leading publisher by overall sales
• The gaming market peaked during the late 2000s–early 2010s
• Platform analysis highlighted the strong market presence of Nintendo and PlayStation ecosystems
Tools Used:
Microsoft Excel | Pivot Tables | Slicers | Dashboard Design | Data Visualization
0
4
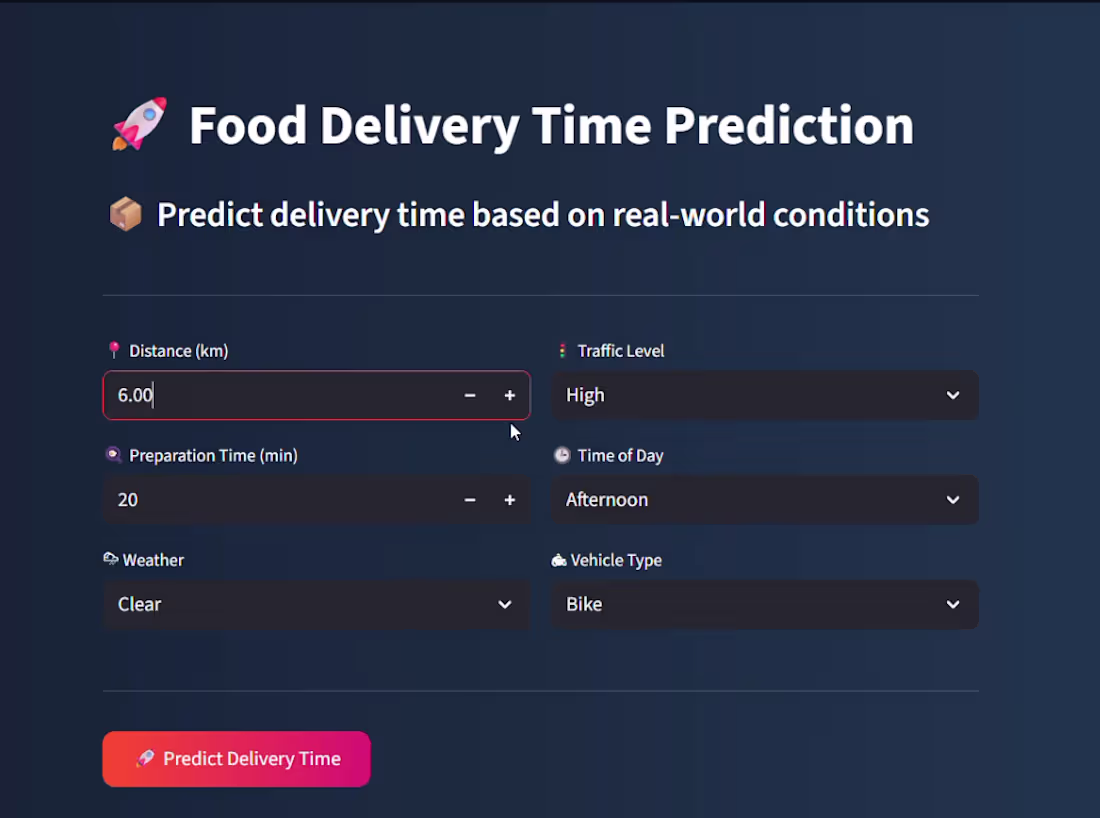
I built a Food Delivery Time Prediction project, and the most important thing I learned wasn't about the model.
It was about the data.
Before building any prediction model, I focused on understanding the operational patterns behind delivery performance and identifying the factors that actually influence delivery time.
Here’s what the workflow involved:
Dataset:
1,000 food delivery records across variables such as distance, weather, traffic level, vehicle type, courier experience, preparation time, and delivery duration.
Exploratory Data Analysis & Preprocessing:
• Handled missing values across Weather, Traffic_Level, and Time_of_Day
• Identified distribution patterns and operational trends within delivery timings
• Analyzed the impact of variables like traffic conditions, distance, and preparation time on delivery performance
• Performed data cleaning, transformation, and feature preparation for modeling
Models & Optimization:
• Built baseline and predictive models using Linear Regression and Random Forest Regressor
• Applied Hyperparameter Tuning using GridSearchCV with 5-fold cross-validation
• Optimized model performance using R² score evaluation
Key Takeaway:
Clean exploratory analysis and strong data understanding often contribute more to model performance than the algorithm itself.
Tools & Technologies:
Python | Pandas | NumPy | Matplotlib | Seaborn | Scikit-learn
1
16
LA has thousands of Airbnb listings, but what actually drives pricing, reviews, and listing concentration across neighbourhoods?
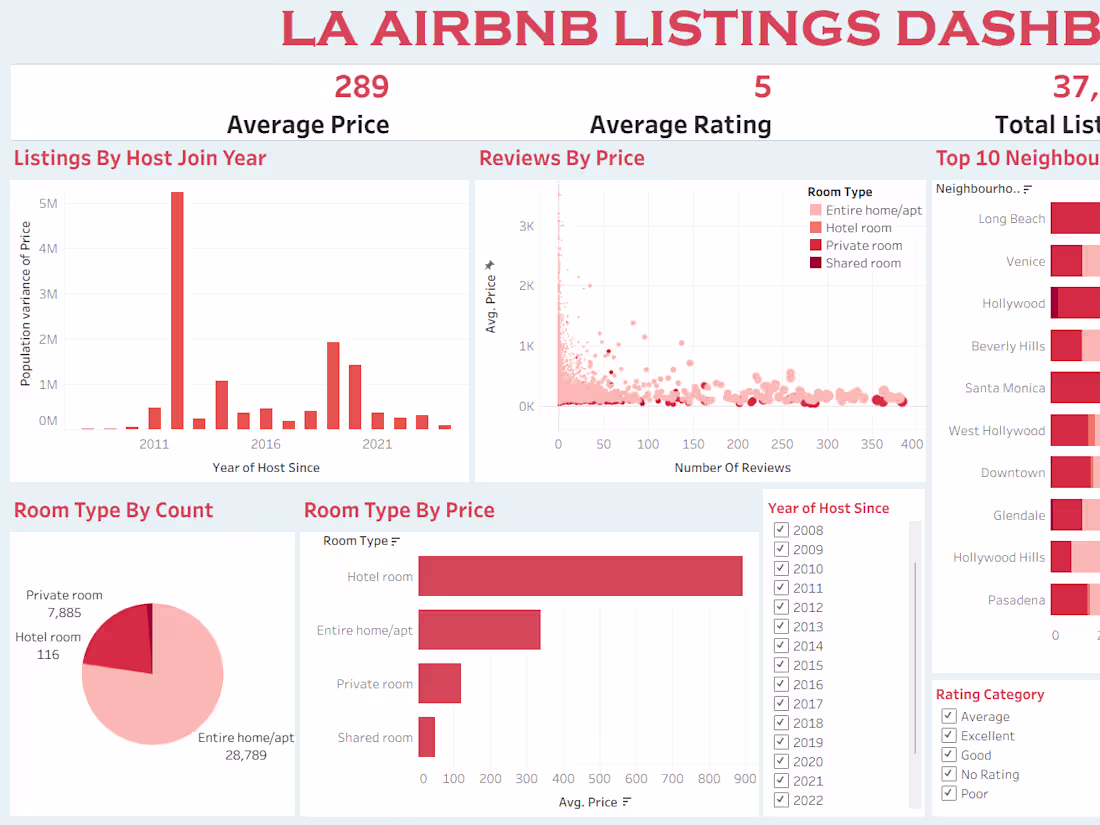
I explored this by building an interactive LA Airbnb Listings Dashboard focused on market patterns, host activity, and customer engagement.
The goal was not just to visualize data, but to understand what drives listing performance and market behavior in the Airbnb ecosystem.
Problem Explored:
Airbnb markets are influenced by multiple operational and customer-driven factors such as pricing, room type, host experience, and review activity.
This dashboard was designed to transform raw listing data into actionable market insights.
Tools & Workflow:
• Tableau for dashboard design and interactive analytics
• Data preparation and field structuring using listing-level datasets
• KPI tracking and filter-driven exploration
• Multi-dimensional analysis across pricing, reviews, room types, and neighbourhoods
Key Insights Identified:
• Entire home or apartment listings dominate LA Airbnb inventory
• Premium neighbourhoods showed significantly higher pricing patterns
• Host onboarding periods revealed noticeable listing concentration trends
• Review volume and pricing displayed varying engagement patterns across room categories
Dashboard Features:
Interactive filters
KPI cards
Neighbourhood analysis
Pricing segmentation
Host and review analysis
Room-type comparison
1
21