
Sai Charan
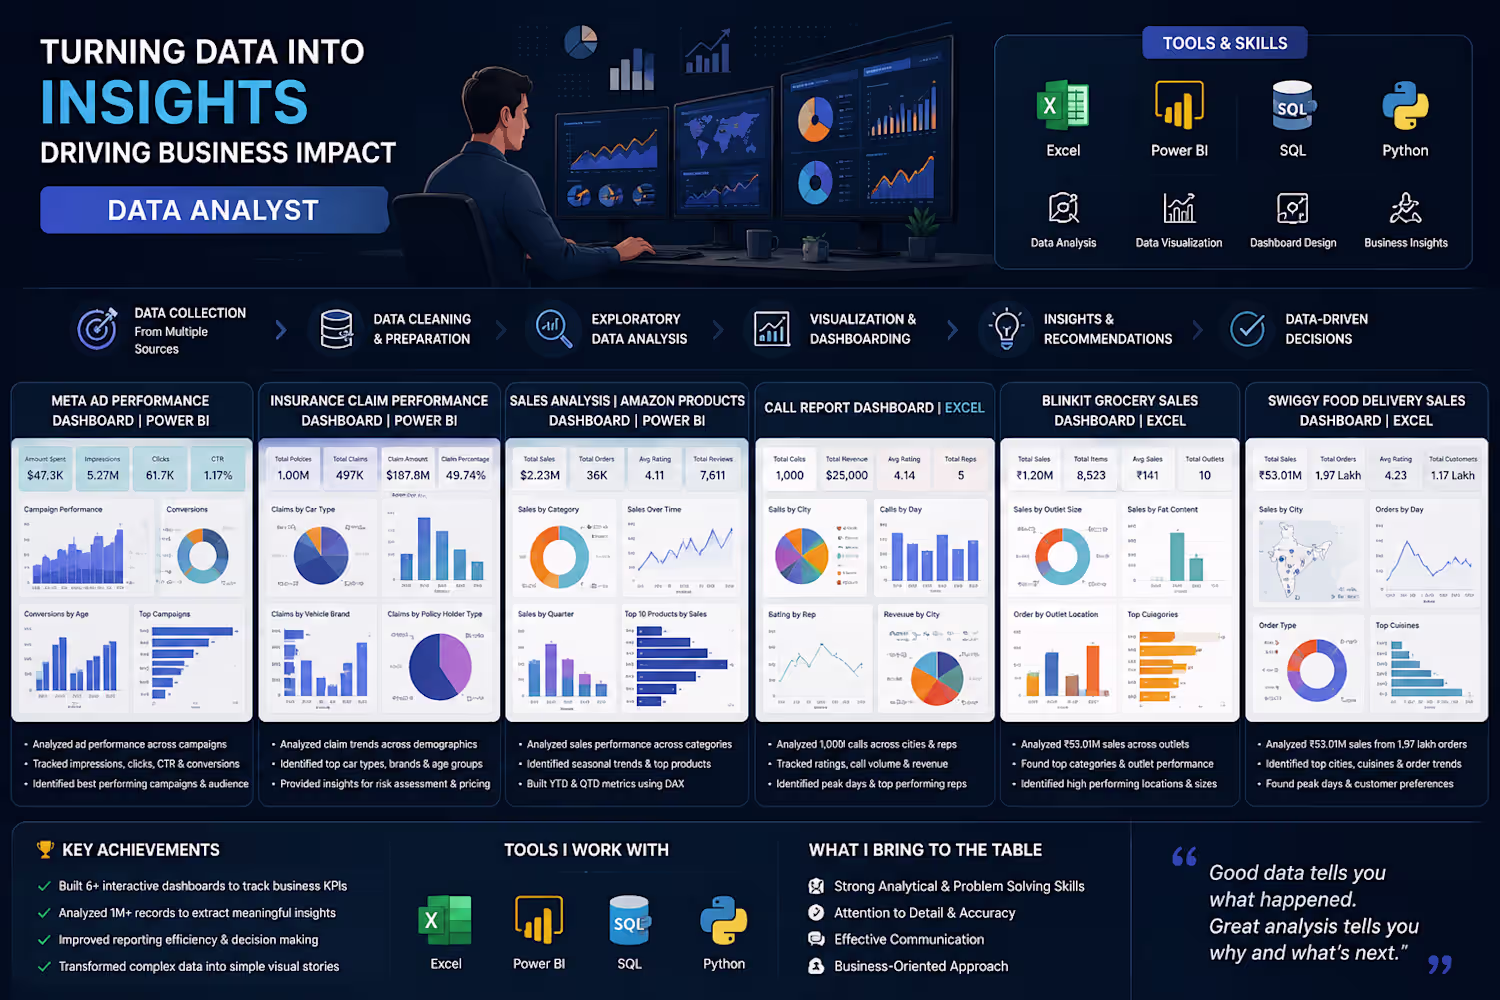
Data Analyst turning raw data into business insights.
New to Contra
Sai is building their profile!
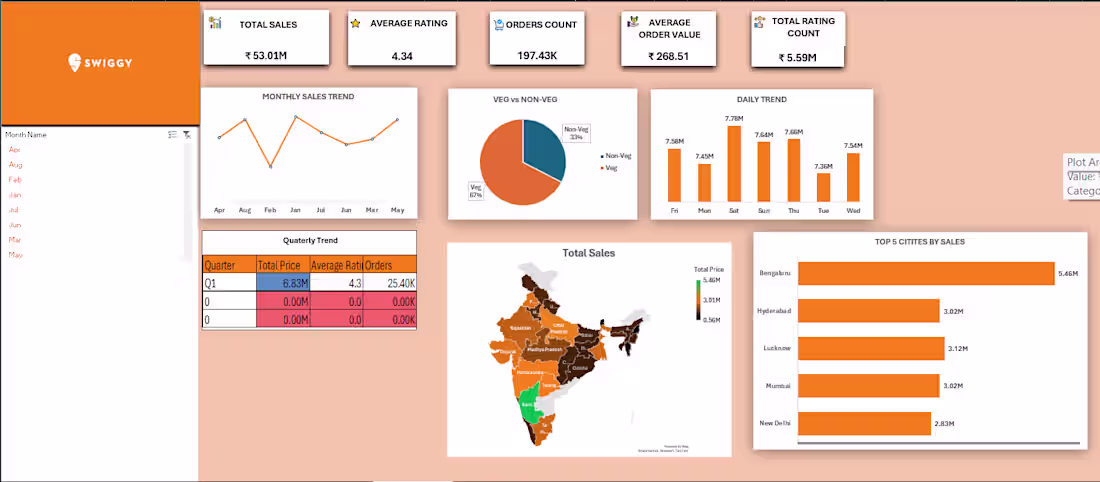
Developed a Swiggy Food Delivery Dashboard to analyze ₹53.01M sales from 1.97 lakh orders across India. Used Pivot Tables, charts, slicers, and geographic heat maps to track sales trends, customer ratings, and city-wise performance. Identified Bengaluru as the top-performing city, veg orders as dominant, and Sundays and Fridays as peak order days.
0
16
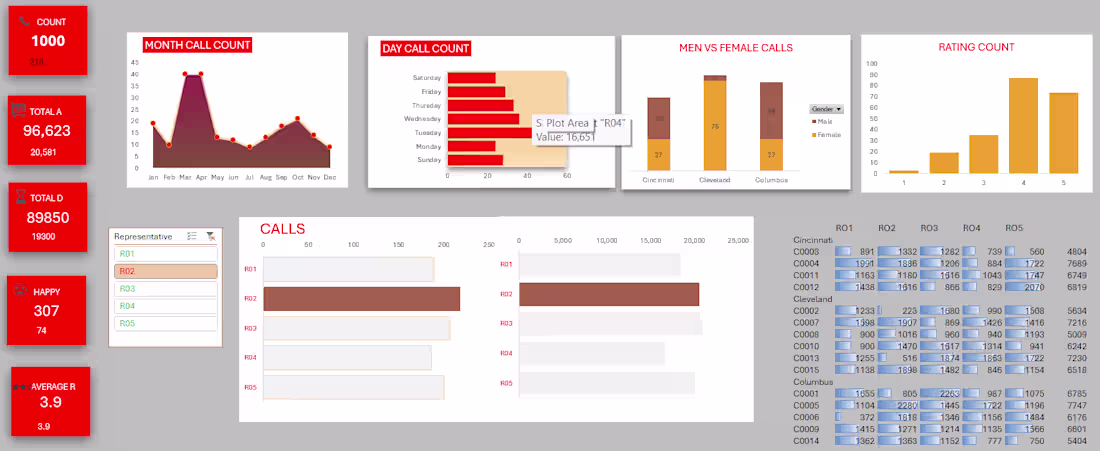
Created an Excel-based Call Center Analytics Dashboard to track 1,000 customer calls across three cities and five representatives. Used Pivot Tables, Pivot Charts, and slicers to analyze customer ratings, call volume, revenue, and representative performance. Identified Cleveland as the busiest city and Friday–Saturday as peak call days while evaluating customer satisfaction trends.
0
20
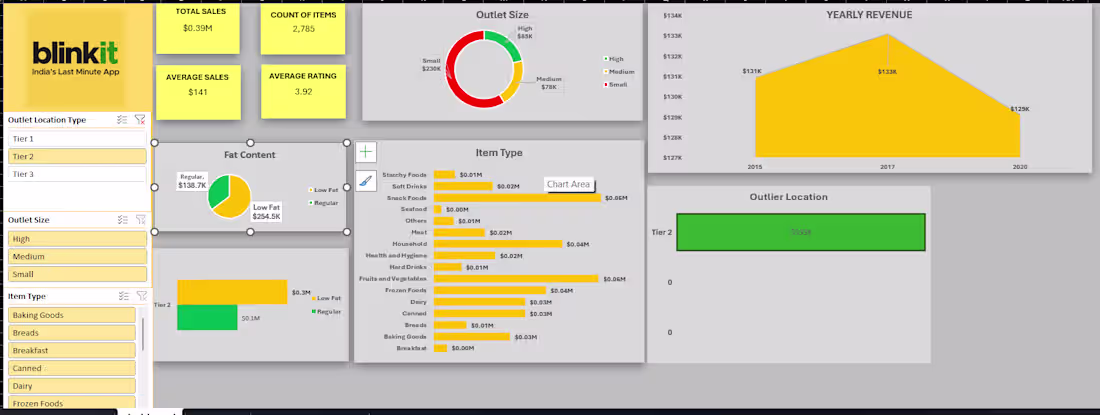
Built a Grocery Sales Analytics Dashboard for Blinkit to analyze ₹1.20M sales data across 8,523 products and multiple outlet categories. Used charts, slicers, and Pivot Tables to identify sales trends, top-selling product categories, and outlet performance. Found that Tier 3 cities and medium outlets generated the highest revenue while low-fat products outsold regular products.
0
29
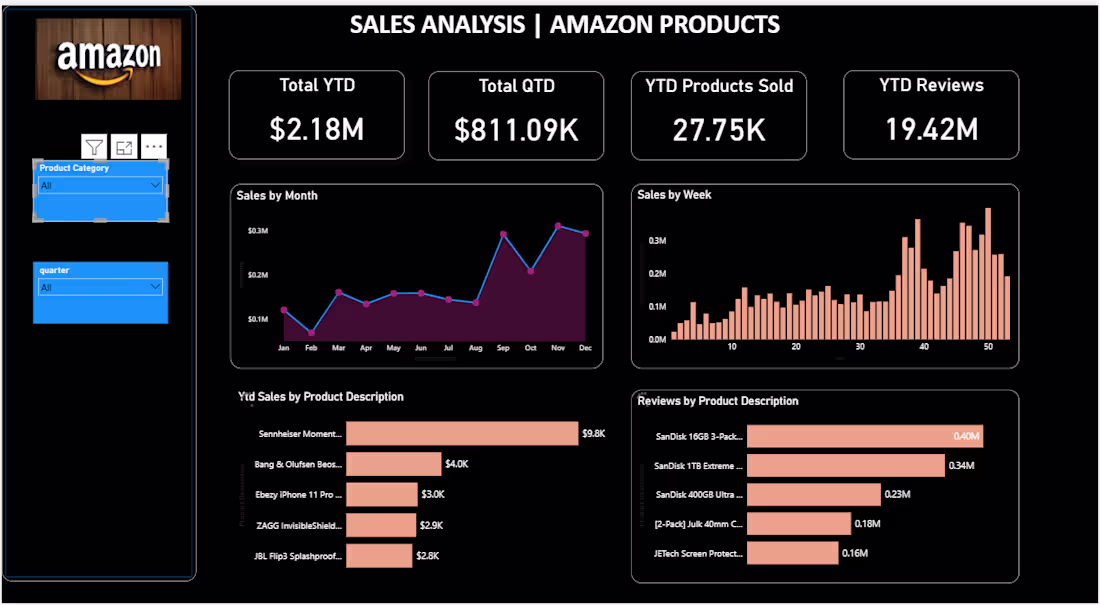
Developed a Power BI sales dashboard to analyze Amazon product performance across categories, quarters, weeks, and months. Created KPI cards, DAX measures, slicers, and trend charts to track sales and customer reviews. Identified strong Q4 seasonal dependency and inconsistencies across categories. Built YTD and QTD calculations using DAX and designed interactive visuals for better business insights and trend analysis.
0
29
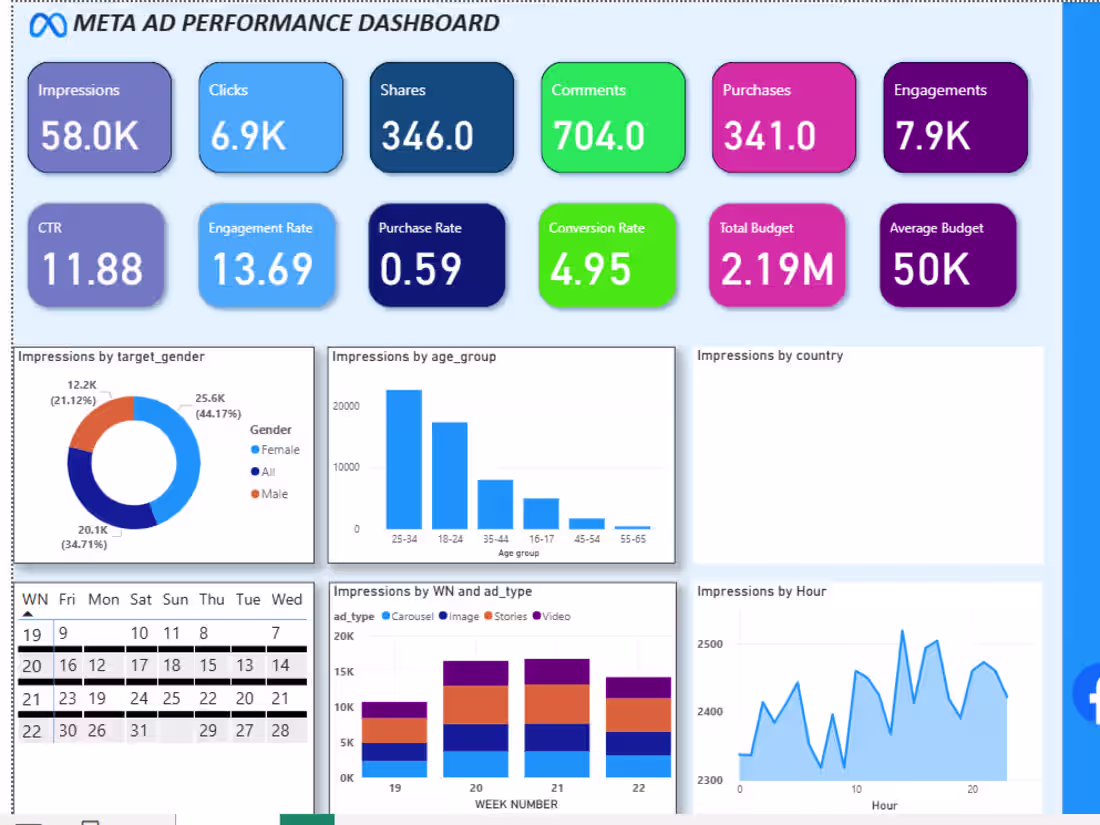
Developed a Power BI dashboard to analyze Meta ad performance across Facebook and Instagram using 12 KPI cards, interactive filters, and dynamic dropdowns. Identified a major decline in August where Instagram purchases dropped and clicks fell by 77% despite the same budget. Analyzed causes including ad fatigue, repeated targeting, and poor budget optimization. Suggested solutions such as refreshing creatives, retargeting users, shifting spend to Facebook, and optimizing campaigns for peak hours.
0
23