
Saad Farooki
AI-powered Excel, reports & business plans expert.
New to Contra
Saad is building their profile!

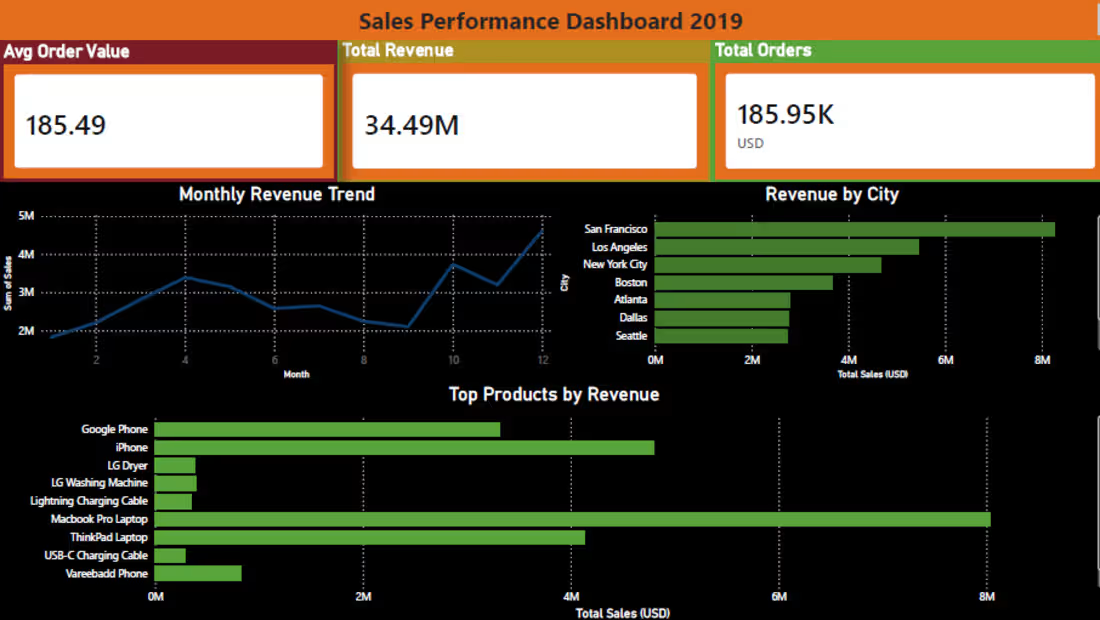
Performed end-to-end data analysis on a 12-month sales dataset containing 185,000+ orders across multiple US cities and product categories. Using SQL, I extracted key business insights including monthly revenue trends, top performing products, city-level revenue breakdown, and peak sales hours. Built a professional Power BI dashboard featuring KPI cards (Total Revenue $34.49M, Total Orders 185.95K, Avg Order Value $185.49), monthly trend line chart, revenue by city bar chart, and top products analysis. Delivered both a SQL analysis report and an interactive Power BI dashboard as final deliverables.
0
8
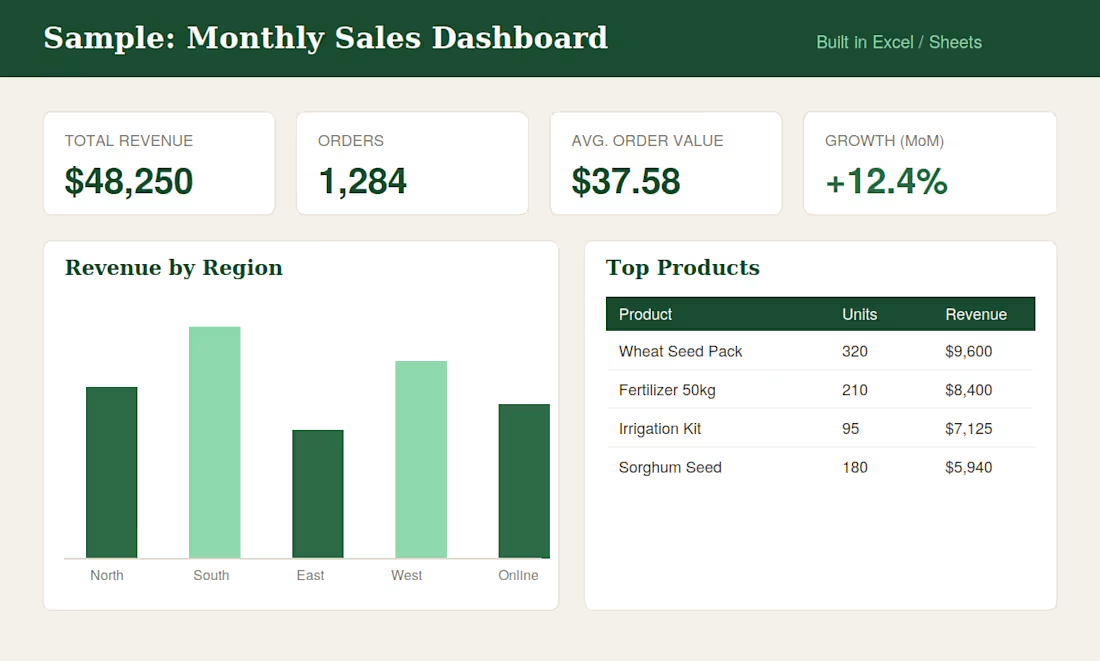
Built an interactive monthly sales dashboard in Excel featuring KPI summary cards, revenue by region charts, pivot tables and automated formulas. Delivered as a clean, ready-to-use file for a business client tracking sales performance across multiple regions and product lines.
0
27