
Power BI Dashboard & Analytics for Data-Driven DecisionsTarang Patel
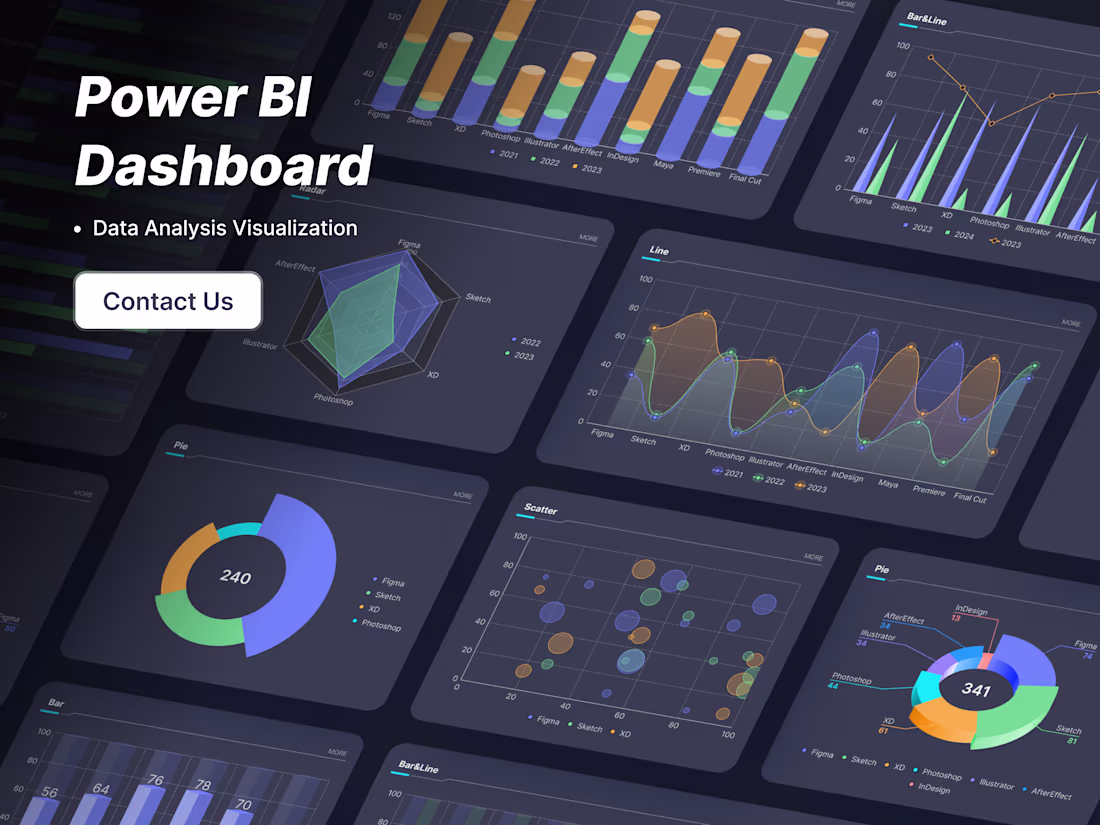
I design interactive Power BI dashboards that turn raw data into clear, actionable insights for better decision-making. My focus is on data accuracy, clean visual design, and performance-optimized dashboards that help teams track KPIs, monitor trends, and make faster, informed business decisions.
What's included
Deliverable 1: Data Analysis & Requirement Gathering
Understand business goals, KPIs, and available data sources to define the right dashboard structure and reporting strategy.
Deliverable 2 : Power BI Dashboard Design
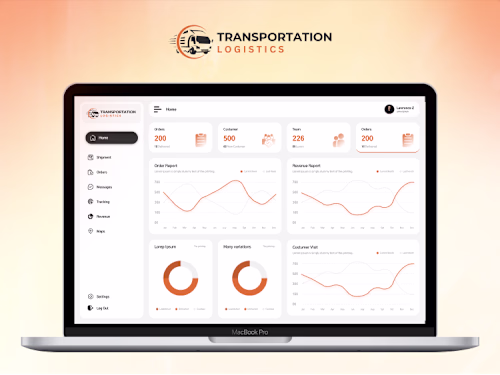
Design custom, interactive Power BI dashboards with clear visualizations, KPIs, slicers, and filters tailored to business needs.
Deliverable 3: Data Modeling & Transformation
Clean, transform, and model data using best practices to ensure accurate, consistent, and reliable reporting.
Deliverable 4: Reports & Insights
Create clear reports that highlight trends, performance metrics, and insights to support informed decision-making.
Deliverable 5: Dashboard Optimization & Sharing
Optimize dashboard performance and enable secure sharing with stakeholders using role-based access and publishing options.
FAQs


Contact for pricing
Tags
Microsoft Excel
Microsoft Power BI
SQL
Data Analyst
Data Modelling Analyst
Data Scientist
Service provided by
Tarang Patel proSurat, India
- 14
- Followers
Power BI Dashboard & Analytics for Data-Driven DecisionsTarang Patel
Contact for pricing
Tags
Microsoft Excel
Microsoft Power BI
SQL
Data Analyst
Data Modelling Analyst
Data Scientist
I design interactive Power BI dashboards that turn raw data into clear, actionable insights for better decision-making. My focus is on data accuracy, clean visual design, and performance-optimized dashboards that help teams track KPIs, monitor trends, and make faster, informed business decisions.
What's included
Deliverable 1: Data Analysis & Requirement Gathering
Understand business goals, KPIs, and available data sources to define the right dashboard structure and reporting strategy.
Deliverable 2 : Power BI Dashboard Design
Design custom, interactive Power BI dashboards with clear visualizations, KPIs, slicers, and filters tailored to business needs.
Deliverable 3: Data Modeling & Transformation
Clean, transform, and model data using best practices to ensure accurate, consistent, and reliable reporting.
Deliverable 4: Reports & Insights
Create clear reports that highlight trends, performance metrics, and insights to support informed decision-making.
Deliverable 5: Dashboard Optimization & Sharing
Optimize dashboard performance and enable secure sharing with stakeholders using role-based access and publishing options.
FAQs
Contact for pricing