
Expert in MS Excel DashboardsJagrit Sharma
I excel in creating interactive Excel dashboards that effectively visualize complex data, using a variety of charts, graphs, and tables. My skills include incorporating slicers, conditional formatting, and other interactive elements to enhance data analysis and user experience.
What's included
I will create dynamic, eye pleasing and interactive Dashboards
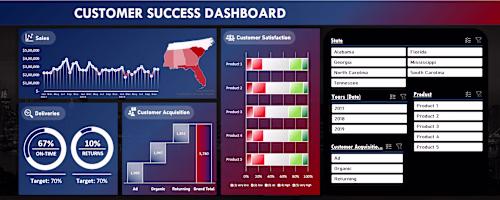
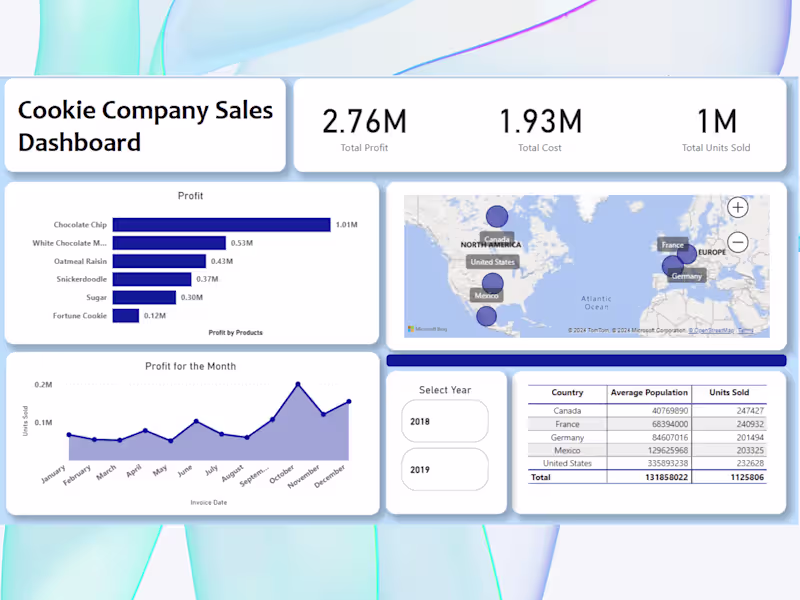
I will create an Excel dashboard, a visual display of key data and metrics, designed to provide a quick overview of information. It will include charts, graphs, and tables that update dynamically as data changes(using slicers and pivot tables), helping you easily analyze trends and make informed decisions.
Example work
Jagrit's other services

Starting at$10
Duration2 days
Tags
Google Sheets
Microsoft Excel
Data Analyst
Data Scientist
Data Visualizer
Service provided by
Jagrit Sharma Chandigarh, India
Expert in MS Excel DashboardsJagrit Sharma
Starting at$10
Duration2 days
Tags
Google Sheets
Microsoft Excel
Data Analyst
Data Scientist
Data Visualizer
I excel in creating interactive Excel dashboards that effectively visualize complex data, using a variety of charts, graphs, and tables. My skills include incorporating slicers, conditional formatting, and other interactive elements to enhance data analysis and user experience.
What's included
I will create dynamic, eye pleasing and interactive Dashboards
I will create an Excel dashboard, a visual display of key data and metrics, designed to provide a quick overview of information. It will include charts, graphs, and tables that update dynamically as data changes(using slicers and pivot tables), helping you easily analyze trends and make informed decisions.
Example work
Jagrit's other services
$10