
Advanced Data Analytics & VisualizationIsaac Somuah
I provide customized data analysis and visualization services using tools like Power BI, Excel, and Python, with a strong focus on creating interactive dashboards.
My expertise spans across warehouse management, logistics, supply chain, business development, and sales, enabling me to deliver insights that are both data-driven and aligned with your business goals.
This combination of technical skills and industry experience ensures that my solutions address your specific challenges and support operational success.
What's included
Data Dictionary and Quality Report
A comprehensive data dictionary that outlines the structure, format, and source of the data collected. This is accompanied by a data quality report assessing the completeness, accuracy, and reliability of the data, identifying any issues that need addressing.
Data Cleaning and Transformation Report
A report highlighting missing or erroneous data, as well as a transformation plan that outlines how the data was structured for analysis.
Data Analysis & Dashboard
A report presenting the findings from the data analysis, including key statistics, trends, and patterns identified. This is complemented by an interactive dashboard that visualizes these insights, allowing stakeholders to explore the data dynamically.
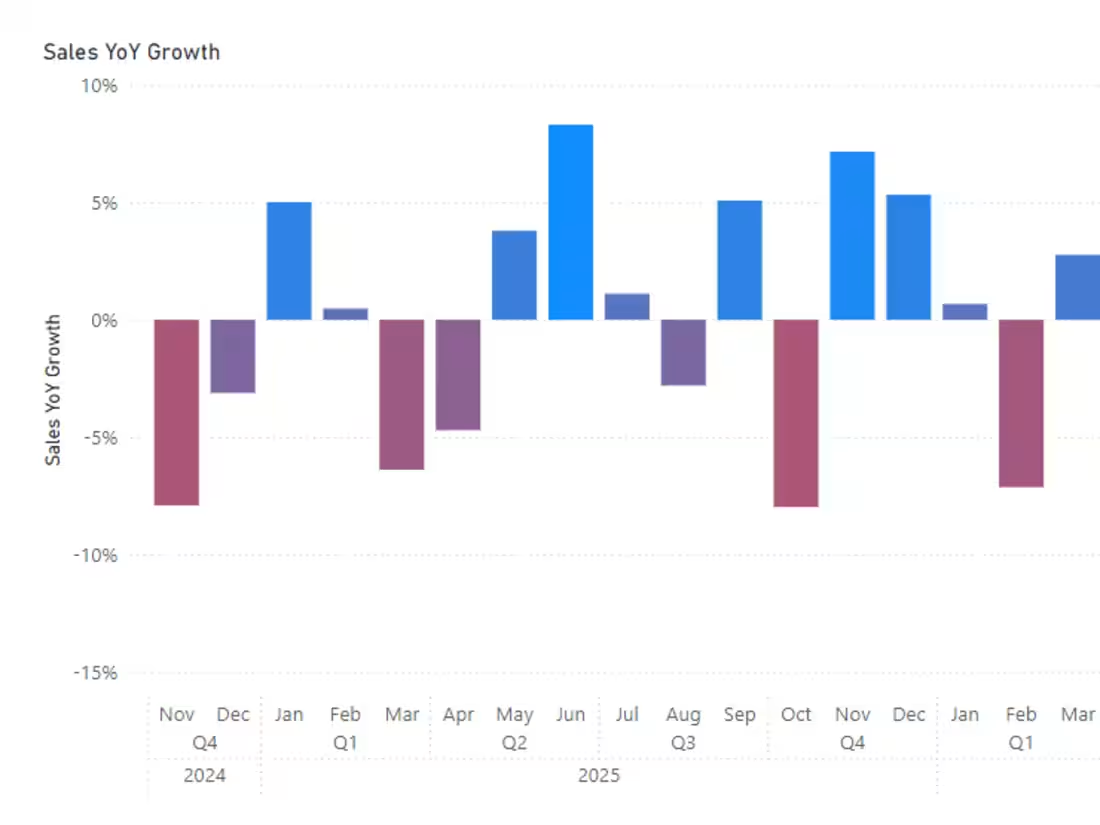
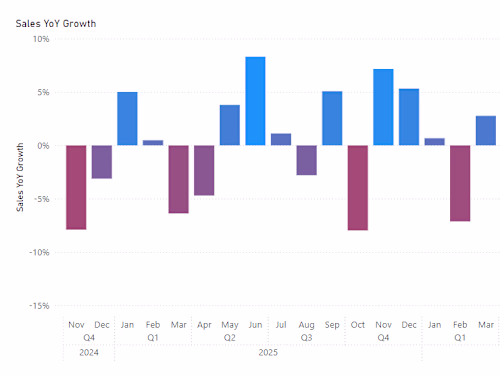
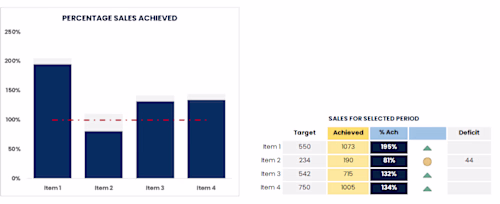
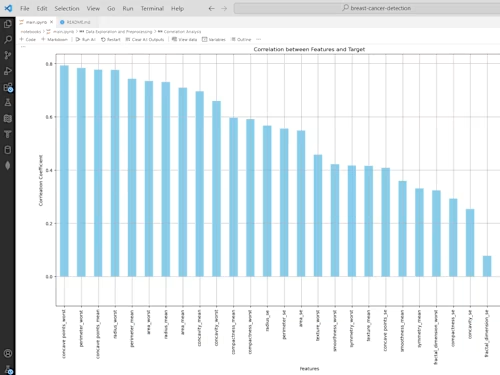
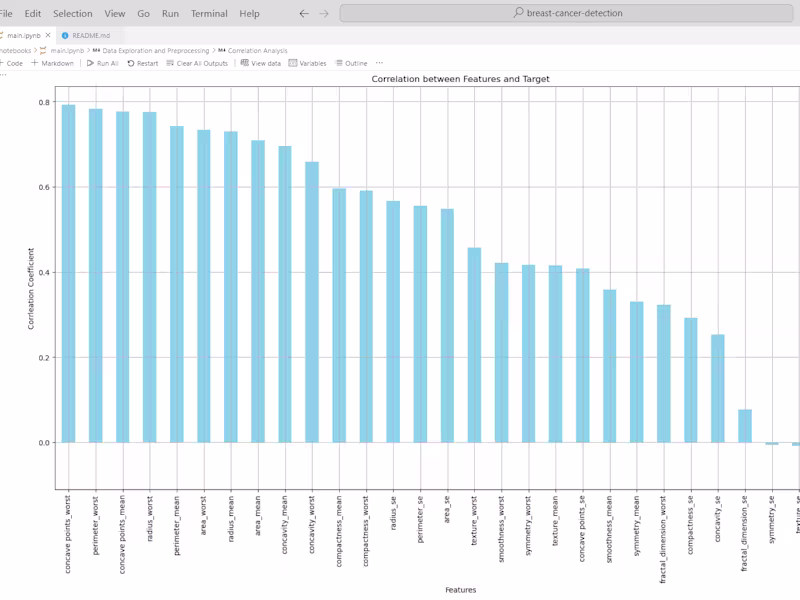
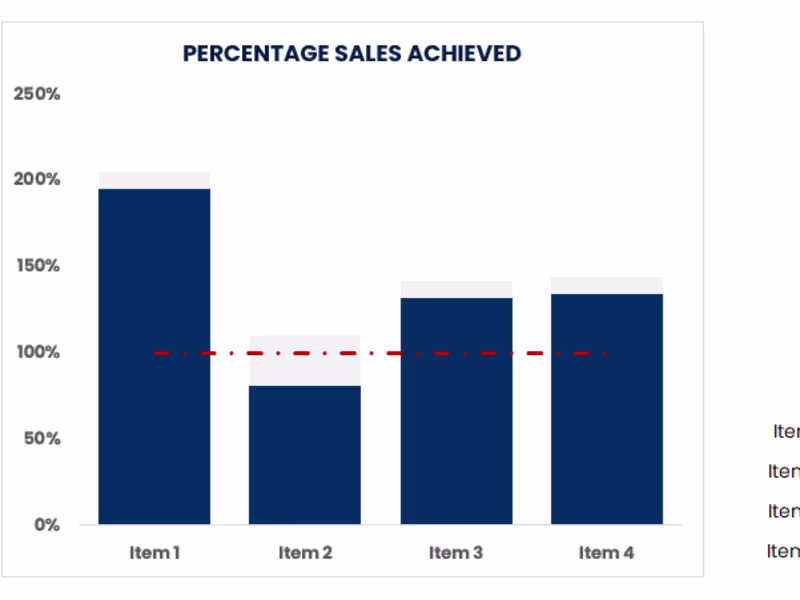
Example work
Contact for pricing
Tags
Microsoft Excel
Microsoft Power BI
pandas
Python
Tableau
Business Analyst
Data Analyst
Data Visualizer
Service provided by
Isaac Somuah Accra, Ghana
Advanced Data Analytics & VisualizationIsaac Somuah
Contact for pricing
Tags
Microsoft Excel
Microsoft Power BI
pandas
Python
Tableau
Business Analyst
Data Analyst
Data Visualizer
I provide customized data analysis and visualization services using tools like Power BI, Excel, and Python, with a strong focus on creating interactive dashboards.
My expertise spans across warehouse management, logistics, supply chain, business development, and sales, enabling me to deliver insights that are both data-driven and aligned with your business goals.
This combination of technical skills and industry experience ensures that my solutions address your specific challenges and support operational success.
What's included
Data Dictionary and Quality Report
A comprehensive data dictionary that outlines the structure, format, and source of the data collected. This is accompanied by a data quality report assessing the completeness, accuracy, and reliability of the data, identifying any issues that need addressing.
Data Cleaning and Transformation Report
A report highlighting missing or erroneous data, as well as a transformation plan that outlines how the data was structured for analysis.
Data Analysis & Dashboard
A report presenting the findings from the data analysis, including key statistics, trends, and patterns identified. This is complemented by an interactive dashboard that visualizes these insights, allowing stakeholders to explore the data dynamically.
Example work
Contact for pricing