
Data Cleaning and Preparation & Data Visualization ServicesAyotomiwa Alao
I offer specialized expertise in data cleaning and visualization, ensuring datasets are transformed into accurate, usable insights. What sets me apart is my meticulous attention to detail in identifying and rectifying data inconsistencies, coupled with a knack for creating visually compelling and insightful data representations. My approach not only enhances data accuracy but also facilitates clearer understanding and decision-making for stakeholders.
What's included
Interactive Data Visualization Dashboard (using Excel, Power BI and Python libs)
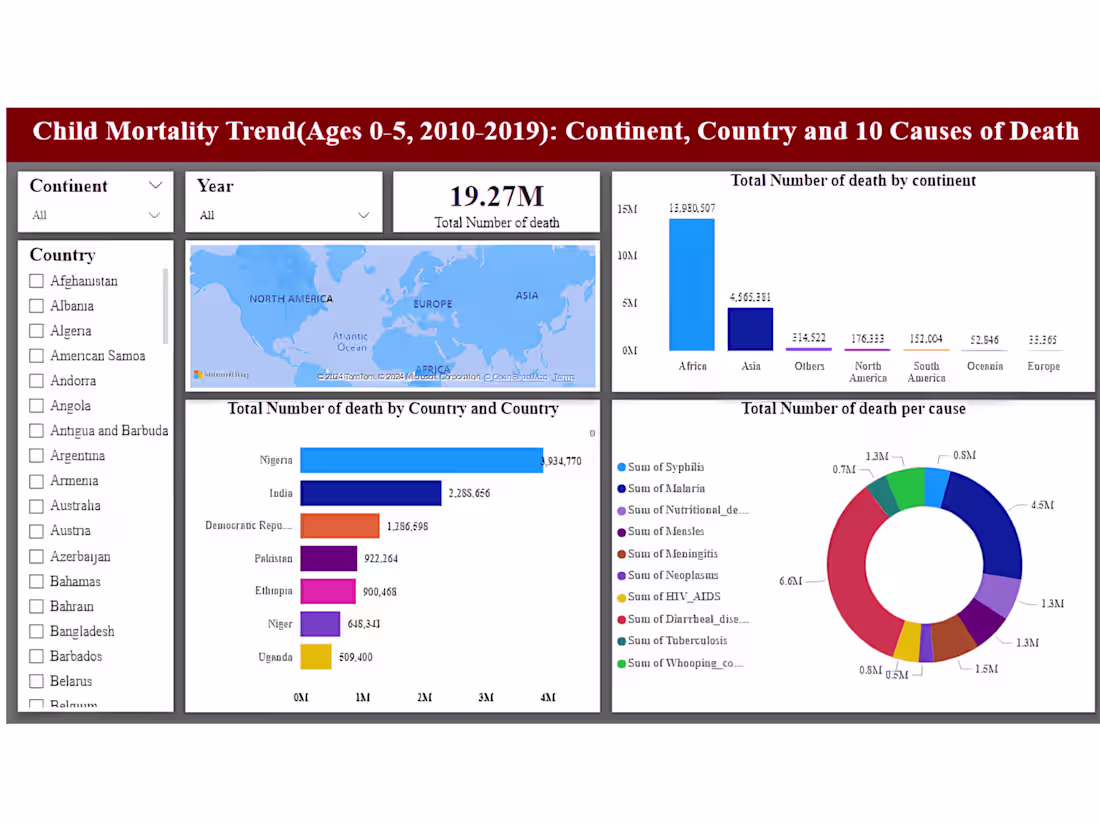
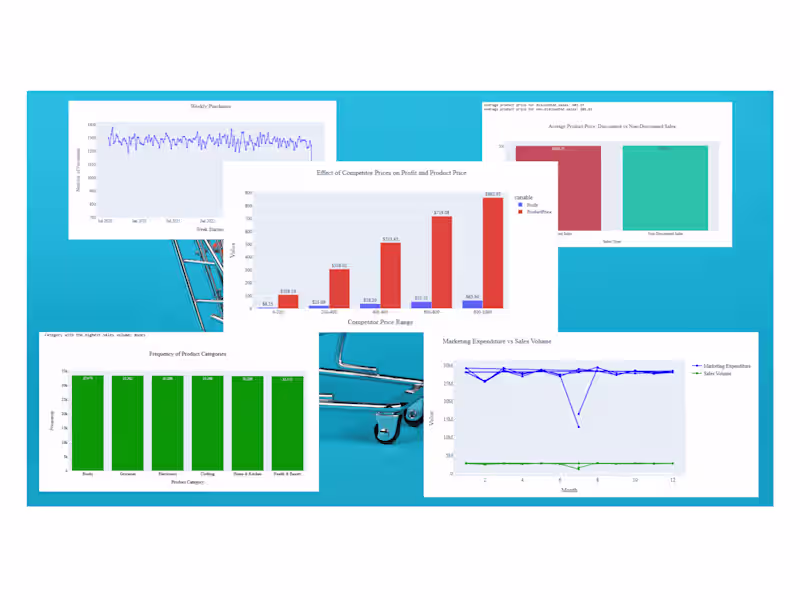
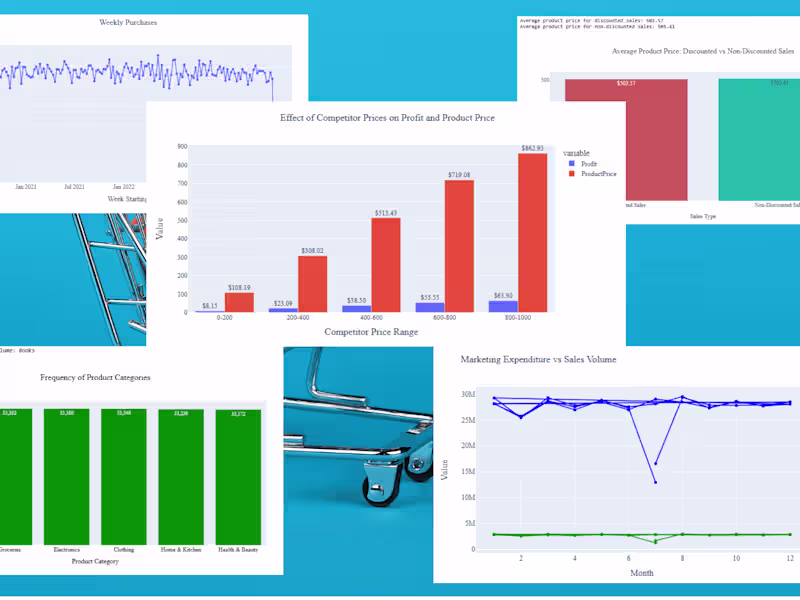
This deliverable will consist of an interactive dashboard designed to communicate key insights from the data analysis. The dashboard will utilize various charts and graphs (e.g., bar charts, pie charts, line graphs, heatmaps) tailored to effectively showcase trends, patterns, and relationships within the data. The visualizations will be interactive, allowing users to filter, drill down, and explore the data in more detail. Additionally, the dashboard will be accompanied by a user guide that explains the purpose of each visualization and how to interpret the information presented.
Cleaned Data Set and Data Cleaning Report (using SQL and Python)
1. Cleaned Data Set: This will be the final data set after undergoing cleaning procedures to ensure its accuracy and consistency. It will be provided in a common format (e.g., CSV, Excel) suitable for further analysis.
2. Data Cleaning Report: This report will document the entire data cleaning process. It will detail the specific issues identified in the raw data, such as missing values, inconsistencies, outliers, or formatting errors. The report will then explain the methods used to address these issues, including any data transformations performed. Additionally, the report will include metrics and visualizations to demonstrate the improvement in data quality after cleaning.
Ayotomiwa 's other services
Contact for pricing
Tags
Matplotlib
Microsoft Excel
Microsoft Power BI
pandas
seaborn
Data Analyst
Data Visualizer
Service provided by
Ayotomiwa Alao Ibadan, Nigeria
Data Cleaning and Preparation & Data Visualization ServicesAyotomiwa Alao
Contact for pricing
Tags
Matplotlib
Microsoft Excel
Microsoft Power BI
pandas
seaborn
Data Analyst
Data Visualizer
I offer specialized expertise in data cleaning and visualization, ensuring datasets are transformed into accurate, usable insights. What sets me apart is my meticulous attention to detail in identifying and rectifying data inconsistencies, coupled with a knack for creating visually compelling and insightful data representations. My approach not only enhances data accuracy but also facilitates clearer understanding and decision-making for stakeholders.
What's included
Interactive Data Visualization Dashboard (using Excel, Power BI and Python libs)
This deliverable will consist of an interactive dashboard designed to communicate key insights from the data analysis. The dashboard will utilize various charts and graphs (e.g., bar charts, pie charts, line graphs, heatmaps) tailored to effectively showcase trends, patterns, and relationships within the data. The visualizations will be interactive, allowing users to filter, drill down, and explore the data in more detail. Additionally, the dashboard will be accompanied by a user guide that explains the purpose of each visualization and how to interpret the information presented.
Cleaned Data Set and Data Cleaning Report (using SQL and Python)
1. Cleaned Data Set: This will be the final data set after undergoing cleaning procedures to ensure its accuracy and consistency. It will be provided in a common format (e.g., CSV, Excel) suitable for further analysis.
2. Data Cleaning Report: This report will document the entire data cleaning process. It will detail the specific issues identified in the raw data, such as missing values, inconsistencies, outliers, or formatting errors. The report will then explain the methods used to address these issues, including any data transformations performed. Additionally, the report will include metrics and visualizations to demonstrate the improvement in data quality after cleaning.
Ayotomiwa 's other services
Contact for pricing