
Data AnalystAyotomiwa Alao
I offer expertise as a data analyst, specializing in deriving actionable insights from complex datasets. What sets me apart is my proficiency in leveraging advanced statistical methods and machine learning algorithms to uncover hidden patterns and trends, coupled with strong communication skills to translate findings into meaningful business recommendations.
What's included
Cleaned Data Set and Data Cleaning Report (using Python or SQL)
This deliverable will include two parts:
1. Cleaned Data Set: This will be the final data set after undergoing cleaning procedures to ensure its accuracy and consistency. It will be provided in a common format (e.g., CSV, Excel) suitable for further analysis.
2. Data Cleaning Report: This report will document the entire data cleaning process. It will detail the specific issues identified in the raw data, such as missing values, inconsistencies, outliers, or formatting errors. The report will then explain the methods used to address these issues, including any data transformations performed. Additionally, the report will include metrics and visualizations to demonstrate the improvement in data quality after cleaning.
Transformed Data Set and Data Transformation Script (using Python or SQL)
This deliverable will include two parts:
1. Transformed Data Set: This will be the final, cleaned and transformed data set ready for analysis. It will be provided in a common format (e.g., CSV, Excel) suitable for the chosen analytical tools.
2. Data Transformation Script: This script will document the specific steps taken to transform the raw data into the final format. The script could be written in a programming language like Python or R, or it could be a visual representation of the transformation process using an ETL (Extract, Transform, Load) tool. The script will serve as a reference for future use or for understanding the modifications made to the data.
Interactive Data Visualization Dashboard (using Power BI)
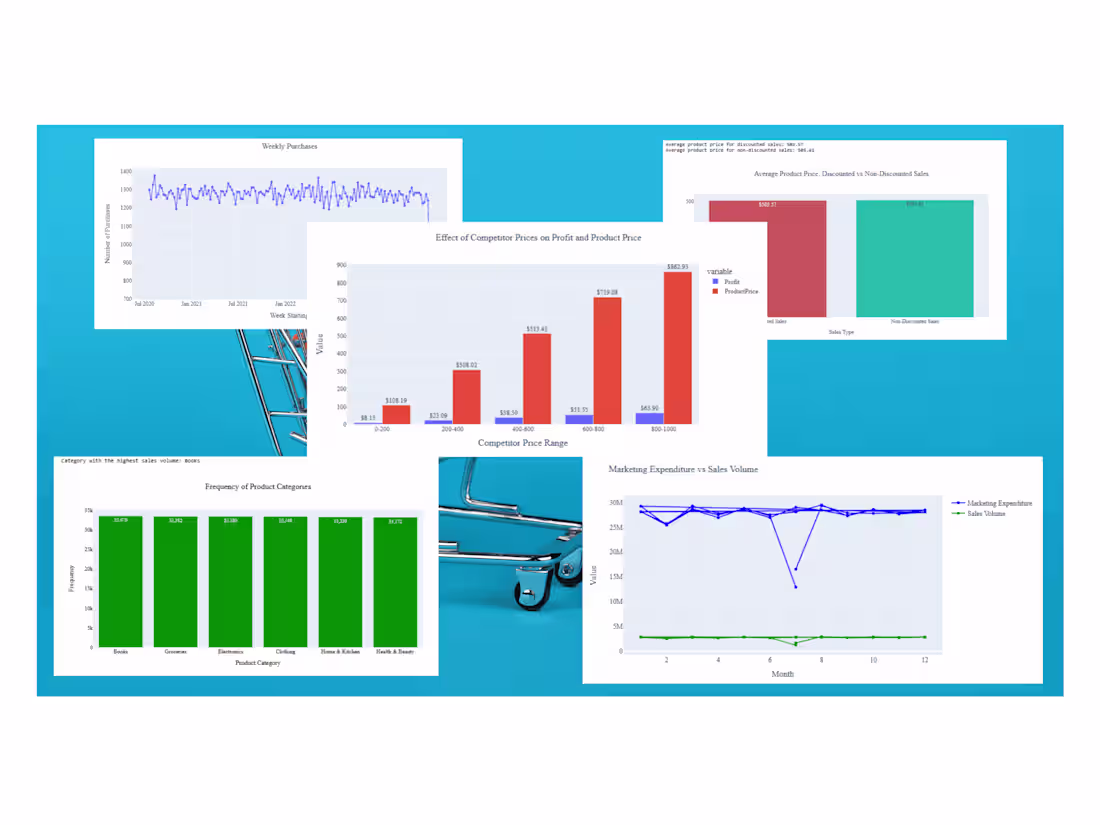
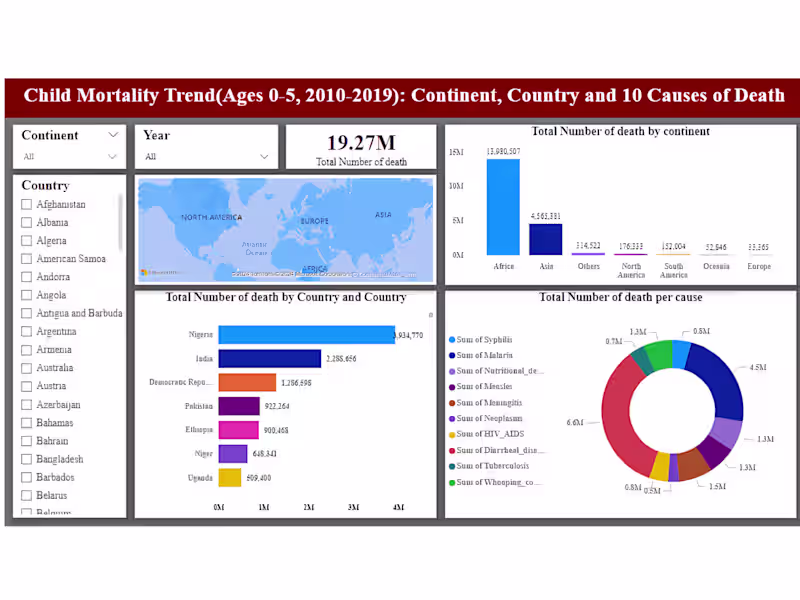
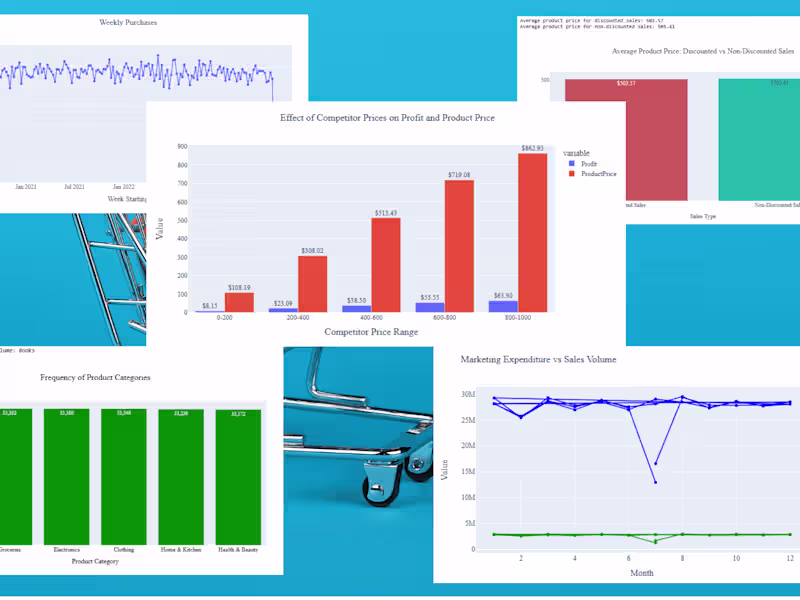
This deliverable will consist of an interactive dashboard designed to communicate key insights from the data analysis. The dashboard will utilize various charts and graphs (e.g., bar charts, pie charts, line graphs, heatmaps) tailored to effectively showcase trends, patterns, and relationships within the data. The visualizations will be interactive, allowing users to filter, drill down, and explore the data in more detail. Additionally, the dashboard will be accompanied by a user guide that explains the purpose of each visualization and how to interpret the information presented.
Scraped Data Set and Web Scraping Script (using Python with Beautiful Soup)
This deliverable will include two parts:
1. Scraped Data Set: This will be the data extracted from the target website(s) relevant to the client's needs. It will be provided in a structured format (e.g., CSV, JSON) suitable for further analysis.
2. Web Scraping Script: This script will document the process of extracting data from the website(s). The script could be written in a programming language like Python or a web scraping library. The script should be well-commented and explain the steps taken to navigate the website, identify and extract the desired data points, and handle any potential errors encountered during scraping.
Data Analysis Report and Code Repository (using Python with libraries)
This deliverable consists of two parts:
1. Data Analysis Report: This report will summarize the key findings from the data analysis phase of the project. It will include details on the research questions addressed, the analytical methods used (e.g., statistical analysis, machine learning), and the insights gained from the data. The report will be presented in a clear and concise manner, tailored for the target audience.
2. Code Repository: This repository will contain the Python code used to perform the data analysis. The code will be well-documented and modular, allowing for easy understanding and replication. Additionally, the code might leverage relevant libraries like:
Pandas for data manipulation and exploration
NumPy for numerical computations
Scikit-learn for machine learning tasks
Matplotlib or Seaborn for creating data visualizations (complementary to a separate visualization deliverable)
Statistical Analysis Report (using Python with libraries)
1. Research questions addressed: Clearly outline the specific questions the statistical analysis aimed to answer.
2. Methodology: Describe the statistical methods used to analyze the data. This could include details on hypothesis testing, correlation analysis, regression analysis, or other relevant techniques.
3. Results: Present the statistical results in a clear and concise way. Include tables, charts, and graphs to effectively communicate findings.
4. Interpretation: Explain the meaning and significance of the statistical results in the context of the research questions.
4. Limitations: Acknowledge any limitations of the data or the statistical methods used.
Contact for pricing
Tags
Microsoft Excel
Microsoft Power BI
Microsoft SQL Server
Python
Data Analyst
Data Scientist
Data Visualizer
Service provided by
Ayotomiwa Alao Ibadan, Nigeria
Data AnalystAyotomiwa Alao
Contact for pricing
Tags
Microsoft Excel
Microsoft Power BI
Microsoft SQL Server
Python
Data Analyst
Data Scientist
Data Visualizer
I offer expertise as a data analyst, specializing in deriving actionable insights from complex datasets. What sets me apart is my proficiency in leveraging advanced statistical methods and machine learning algorithms to uncover hidden patterns and trends, coupled with strong communication skills to translate findings into meaningful business recommendations.
What's included
Cleaned Data Set and Data Cleaning Report (using Python or SQL)
This deliverable will include two parts:
1. Cleaned Data Set: This will be the final data set after undergoing cleaning procedures to ensure its accuracy and consistency. It will be provided in a common format (e.g., CSV, Excel) suitable for further analysis.
2. Data Cleaning Report: This report will document the entire data cleaning process. It will detail the specific issues identified in the raw data, such as missing values, inconsistencies, outliers, or formatting errors. The report will then explain the methods used to address these issues, including any data transformations performed. Additionally, the report will include metrics and visualizations to demonstrate the improvement in data quality after cleaning.
Transformed Data Set and Data Transformation Script (using Python or SQL)
This deliverable will include two parts:
1. Transformed Data Set: This will be the final, cleaned and transformed data set ready for analysis. It will be provided in a common format (e.g., CSV, Excel) suitable for the chosen analytical tools.
2. Data Transformation Script: This script will document the specific steps taken to transform the raw data into the final format. The script could be written in a programming language like Python or R, or it could be a visual representation of the transformation process using an ETL (Extract, Transform, Load) tool. The script will serve as a reference for future use or for understanding the modifications made to the data.
Interactive Data Visualization Dashboard (using Power BI)
This deliverable will consist of an interactive dashboard designed to communicate key insights from the data analysis. The dashboard will utilize various charts and graphs (e.g., bar charts, pie charts, line graphs, heatmaps) tailored to effectively showcase trends, patterns, and relationships within the data. The visualizations will be interactive, allowing users to filter, drill down, and explore the data in more detail. Additionally, the dashboard will be accompanied by a user guide that explains the purpose of each visualization and how to interpret the information presented.
Scraped Data Set and Web Scraping Script (using Python with Beautiful Soup)
This deliverable will include two parts:
1. Scraped Data Set: This will be the data extracted from the target website(s) relevant to the client's needs. It will be provided in a structured format (e.g., CSV, JSON) suitable for further analysis.
2. Web Scraping Script: This script will document the process of extracting data from the website(s). The script could be written in a programming language like Python or a web scraping library. The script should be well-commented and explain the steps taken to navigate the website, identify and extract the desired data points, and handle any potential errors encountered during scraping.
Data Analysis Report and Code Repository (using Python with libraries)
This deliverable consists of two parts:
1. Data Analysis Report: This report will summarize the key findings from the data analysis phase of the project. It will include details on the research questions addressed, the analytical methods used (e.g., statistical analysis, machine learning), and the insights gained from the data. The report will be presented in a clear and concise manner, tailored for the target audience.
2. Code Repository: This repository will contain the Python code used to perform the data analysis. The code will be well-documented and modular, allowing for easy understanding and replication. Additionally, the code might leverage relevant libraries like:
Pandas for data manipulation and exploration
NumPy for numerical computations
Scikit-learn for machine learning tasks
Matplotlib or Seaborn for creating data visualizations (complementary to a separate visualization deliverable)
Statistical Analysis Report (using Python with libraries)
1. Research questions addressed: Clearly outline the specific questions the statistical analysis aimed to answer.
2. Methodology: Describe the statistical methods used to analyze the data. This could include details on hypothesis testing, correlation analysis, regression analysis, or other relevant techniques.
3. Results: Present the statistical results in a clear and concise way. Include tables, charts, and graphs to effectively communicate findings.
4. Interpretation: Explain the meaning and significance of the statistical results in the context of the research questions.
4. Limitations: Acknowledge any limitations of the data or the statistical methods used.
Contact for pricing