
Predictive Analytics ConsultantAyotomiwa Alao
Ayotomiwa applied statistical methods to provide predictive analytics services. He uncovered patterns in data to offer actionable business insights.
What's included
Predictive Model Report
This report will document the development and evaluation of a predictive model. It will include information on the model's training data, the model selection process, and the model's performance on a hold-out test set.
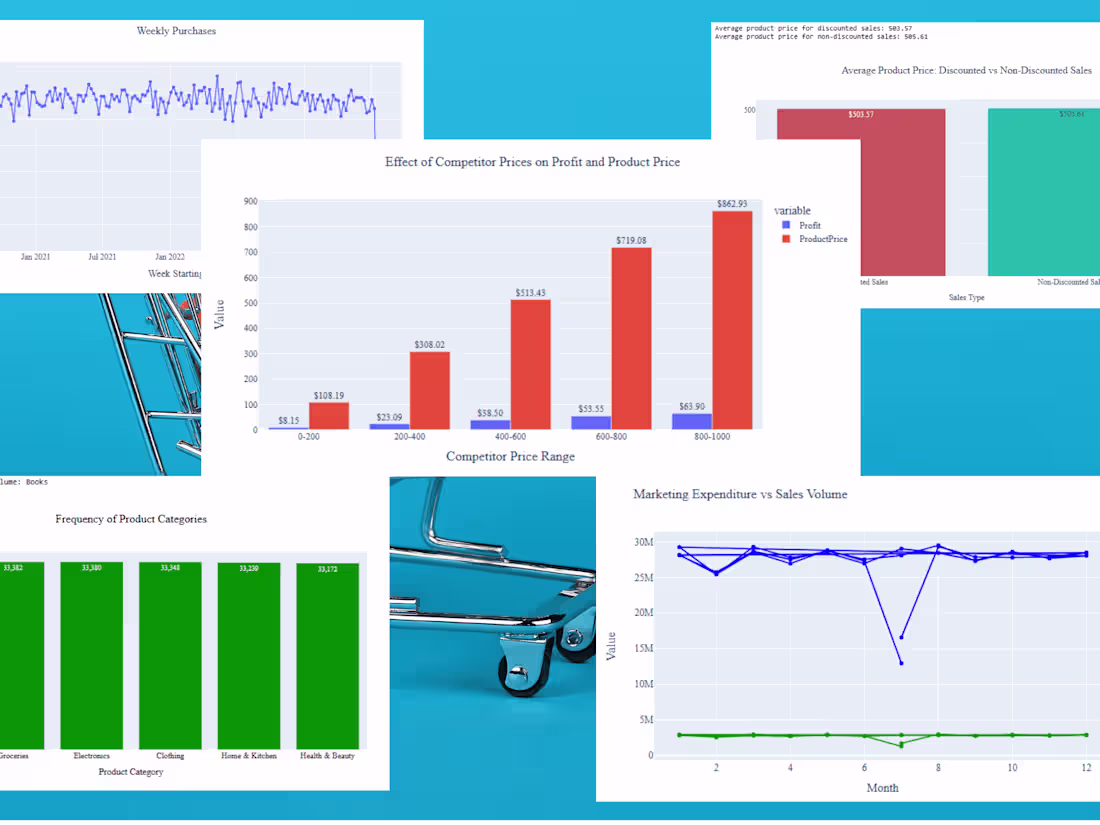
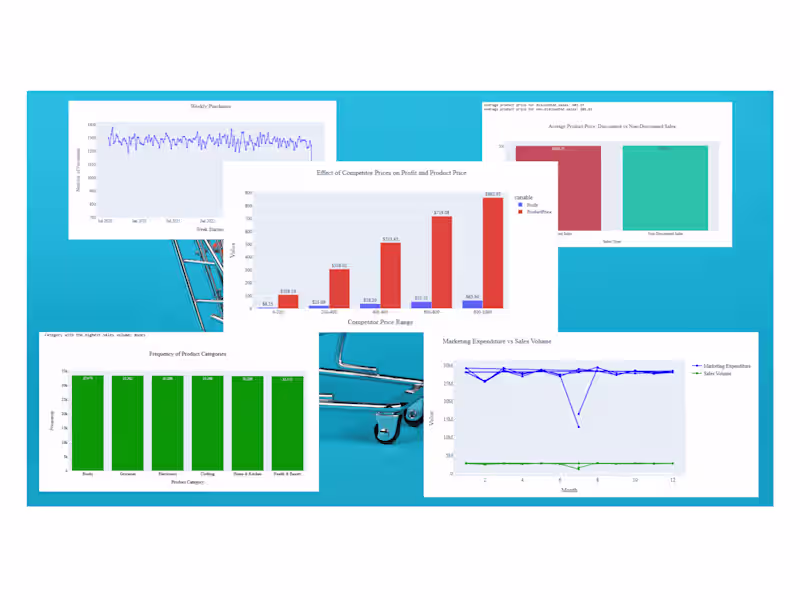
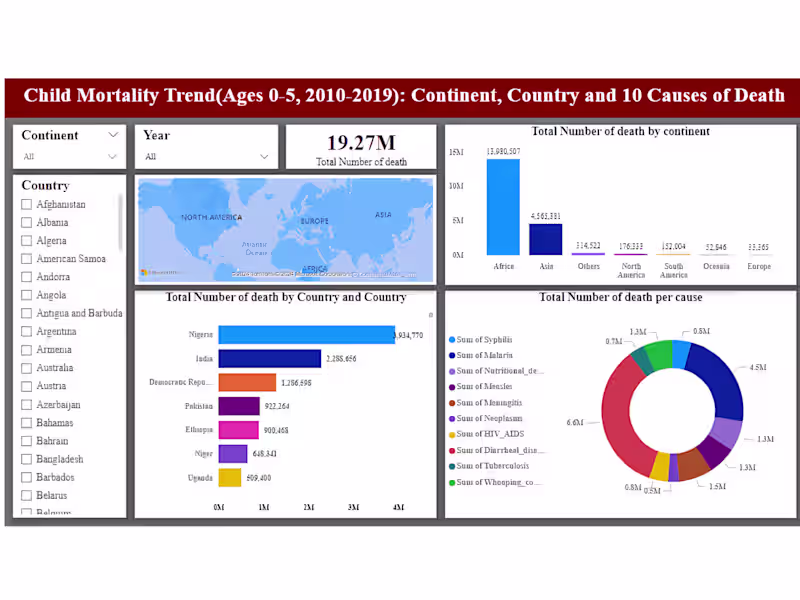
Interactive Data Visualization Dashboard
This deliverable will consist of an interactive dashboard designed to communicate key insights from the data analysis. The dashboard will utilize various charts and graphs (e.g., bar charts, pie charts, line graphs, heatmaps) tailored to effectively showcase trends, patterns, and relationships within the data. The visualizations will be interactive, allowing users to filter, drill down, and explore the data in more detail. Additionally, the dashboard will be accompanied by a user guide that explains the purpose of each visualization and how to interpret the information presented.
Contact for pricing
Tags
MATLAB
Microsoft Excel
pandas
Tableau
Data Analyst
Data Modelling Analyst
Data Visualizer
Service provided by
Ayotomiwa Alao Ibadan, Nigeria
Predictive Analytics ConsultantAyotomiwa Alao
Contact for pricing
Tags
MATLAB
Microsoft Excel
pandas
Tableau
Data Analyst
Data Modelling Analyst
Data Visualizer
Ayotomiwa applied statistical methods to provide predictive analytics services. He uncovered patterns in data to offer actionable business insights.
What's included
Predictive Model Report
This report will document the development and evaluation of a predictive model. It will include information on the model's training data, the model selection process, and the model's performance on a hold-out test set.
Interactive Data Visualization Dashboard
This deliverable will consist of an interactive dashboard designed to communicate key insights from the data analysis. The dashboard will utilize various charts and graphs (e.g., bar charts, pie charts, line graphs, heatmaps) tailored to effectively showcase trends, patterns, and relationships within the data. The visualizations will be interactive, allowing users to filter, drill down, and explore the data in more detail. Additionally, the dashboard will be accompanied by a user guide that explains the purpose of each visualization and how to interpret the information presented.
Contact for pricing