
Create or Design an Interactive Data Analysis Dashboard.

Starting at
$
500
About this service
Summary
Deliverables
What's included
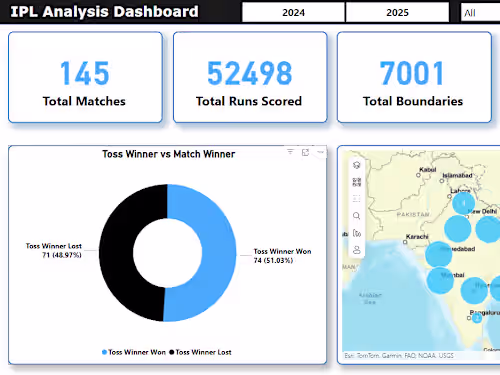
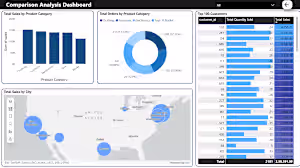
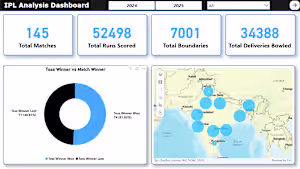
Interactive Dashboard Report
A fully functional, visually compelling dashboard using Power BI or Tableau, showing key business metrics, trends, and actionable insights tailored to the client's data.
Data Cleaning & Preprocessing Report
Cleaned and structured dataset with null values handled, outliers removed, and variables transformed for optimal analysis — ready for direct use in BI tools or modeling.
Business Insights Summary
Concise report summarizing findings from data analysis, including growth trends, pain points, and actionable recommendations, presented in PDF or slide deck format.
Example projects


Duration
2 weeks
Skills and tools


Industries