
Data Analysis and ReportingBethany Smith
Do you have data but aren’t sure how to make sense of it — or how to communicate it clearly to others? I help organizations turn raw, messy datasets into meaningful, actionable insights through rigorous analysis and professional reporting.
With over 8 years of experience supporting data-driven projects, I specialize in cleaning, analyzing, and translating data into reporting tools that inform decisions, drive strategy, and tell a clear story.
Whether you're working with survey results, operational data, performance metrics, or research data, I offer a full suite of data services tailored to your needs.
Services include:
Data cleaning, transformation, and preparation
Statistical analysis (quantitative and qualitative)
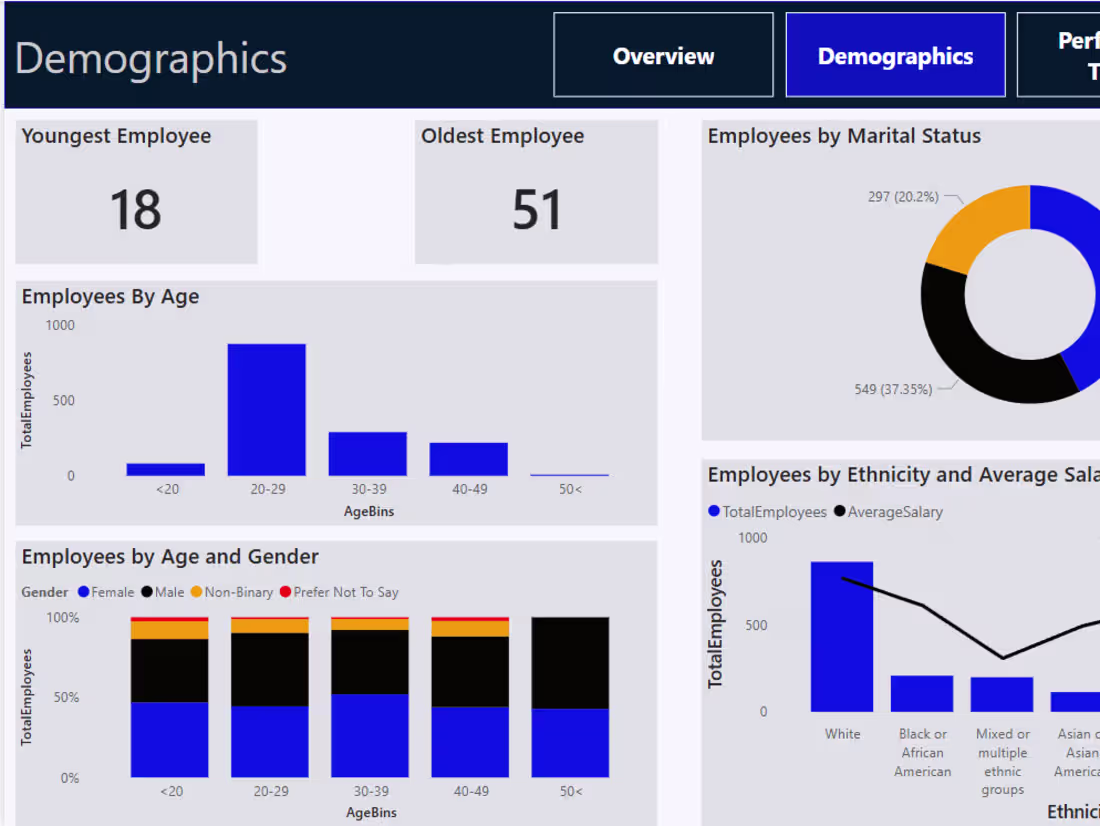
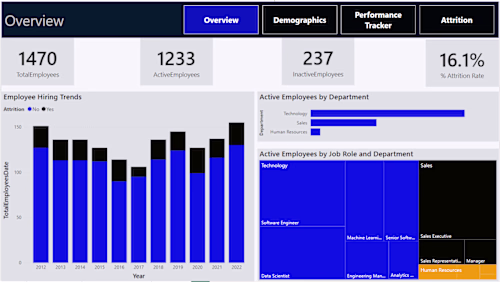
Custom dashboards and reporting tools
Data visualization using R, Excel, or Power BI
Clear, structured reporting with visual summaries and takeaways
What's included
Data cleaning, transformation, and preparation
I begin by assessing the structure and quality of your data, cleaning and organizing it as needed.
Statistical analysis (quantitative and qualitative)
I then apply appropriate statistical methods — from descriptive statistics to ANOVA, Chi-square tests, and regression models — depending on your project goals. I’m proficient in R, Excel, SPSS, and Power BI, and I’m happy to work in the environment you prefer.
Report development, including data visualizations
Depending on your project needs, I create reporting documents, slide decks, executive summaries, and visual dashboards that are tailored to your requirements. My deliverables are always polished, presentation-ready, and aligned with your goals and audience.
Starting at$30 /hr
Tags
IBM SPSS
Microsoft Excel
Microsoft Power BI
R
Data Analyst
Data Visualizer
Statistician
Service provided by
Bethany Smith Baltimore, USA
- 2
- Followers
Data Analysis and ReportingBethany Smith
Starting at$30 /hr
Tags
IBM SPSS
Microsoft Excel
Microsoft Power BI
R
Data Analyst
Data Visualizer
Statistician
Do you have data but aren’t sure how to make sense of it — or how to communicate it clearly to others? I help organizations turn raw, messy datasets into meaningful, actionable insights through rigorous analysis and professional reporting.
With over 8 years of experience supporting data-driven projects, I specialize in cleaning, analyzing, and translating data into reporting tools that inform decisions, drive strategy, and tell a clear story.
Whether you're working with survey results, operational data, performance metrics, or research data, I offer a full suite of data services tailored to your needs.
Services include:
Data cleaning, transformation, and preparation
Statistical analysis (quantitative and qualitative)
Custom dashboards and reporting tools
Data visualization using R, Excel, or Power BI
Clear, structured reporting with visual summaries and takeaways
What's included
Data cleaning, transformation, and preparation
I begin by assessing the structure and quality of your data, cleaning and organizing it as needed.
Statistical analysis (quantitative and qualitative)
I then apply appropriate statistical methods — from descriptive statistics to ANOVA, Chi-square tests, and regression models — depending on your project goals. I’m proficient in R, Excel, SPSS, and Power BI, and I’m happy to work in the environment you prefer.
Report development, including data visualizations
Depending on your project needs, I create reporting documents, slide decks, executive summaries, and visual dashboards that are tailored to your requirements. My deliverables are always polished, presentation-ready, and aligned with your goals and audience.
$30 /hr