
"Turning Data into Decisions."Arsal Khan
Experienced and detail-oriented Data Analyst with a passion for transforming complex datasets into actionable insights. Proficient in statistical analysis, data visualization, and data mining techniques Skilled in using various programming languages and analytical tools to derive meaningful conclusions and drive business growth.
What's included
Services offered
- Data Collection and Cleaning
Deliverable: Clean, Structured Dataset
Description: Collect, clean, and preprocess raw data from various sources, ensuring consistency, accuracy, and completeness. Deliver a structured dataset ready for analysis with well-documented data transformations and validations.
- Exploratory Data Analysis (EDA)
Deliverable: Initial Insights and Patterns Report
Description: Conduct EDA to understand trends, outliers, and patterns within the dataset. Provide a report with key metrics, descriptive statistics, and visualizations that reveal initial insights and any significant data anomalies.
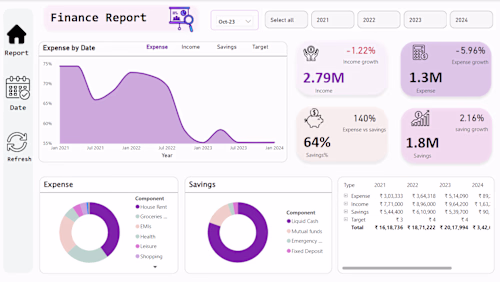
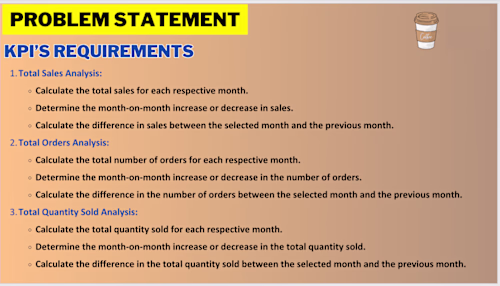
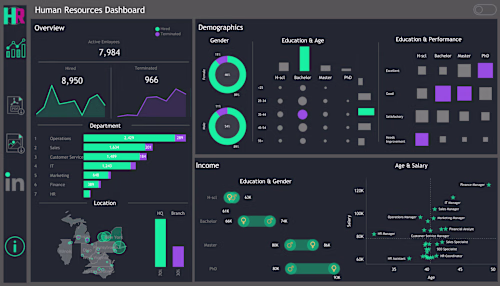
- Key Performance Indicator (KPI) Dashboard
Deliverable: Interactive KPI Dashboard
Description: Develop an interactive, user-friendly dashboard (e.g., in Power BI, Tableau, or Excel) showcasing critical KPIs and metrics. This dashboard should enable stakeholders to monitor performance in real time and make data-driven decisions.
Services offered
- Trend and Predictive Analysis
Deliverable: Trend Analysis Report and Forecasts
Description: Analyze historical data to identify trends and patterns. Provide a report with trend analysis and predictive insights (e.g., linear regression, time series forecasting) to support future planning and strategy.
- Ad-hoc Analysis and Data Queries
Deliverable: Custom Data Reports and SQL Queries
Description: Respond to ad-hoc data requests with tailored reports and SQL queries to address specific business questions. Deliver clean, well-documented query scripts and summary reports that directly answer the queries.
- Data Visualization and Reporting
Deliverable: Visual Reports and Presentations
Description: Create clear, insightful visualizations (charts, graphs, infographics) to communicate complex data findings in a digestible format. Deliver presentations or reports with visuals that help stakeholders quickly understand and act on the data insights.
Arsal's other services

Starting at$10
Duration1 week
Tags
MATLAB
Microsoft Excel
pandas
Tableau
Business Analyst
Data Analyst
Data Visualizer
Service provided by
Arsal Khan Mumbai, India
"Turning Data into Decisions."Arsal Khan
Starting at$10
Duration1 week
Tags
MATLAB
Microsoft Excel
pandas
Tableau
Business Analyst
Data Analyst
Data Visualizer
Experienced and detail-oriented Data Analyst with a passion for transforming complex datasets into actionable insights. Proficient in statistical analysis, data visualization, and data mining techniques Skilled in using various programming languages and analytical tools to derive meaningful conclusions and drive business growth.
What's included
Services offered
- Data Collection and Cleaning
Deliverable: Clean, Structured Dataset
Description: Collect, clean, and preprocess raw data from various sources, ensuring consistency, accuracy, and completeness. Deliver a structured dataset ready for analysis with well-documented data transformations and validations.
- Exploratory Data Analysis (EDA)
Deliverable: Initial Insights and Patterns Report
Description: Conduct EDA to understand trends, outliers, and patterns within the dataset. Provide a report with key metrics, descriptive statistics, and visualizations that reveal initial insights and any significant data anomalies.
- Key Performance Indicator (KPI) Dashboard
Deliverable: Interactive KPI Dashboard
Description: Develop an interactive, user-friendly dashboard (e.g., in Power BI, Tableau, or Excel) showcasing critical KPIs and metrics. This dashboard should enable stakeholders to monitor performance in real time and make data-driven decisions.
Services offered
- Trend and Predictive Analysis
Deliverable: Trend Analysis Report and Forecasts
Description: Analyze historical data to identify trends and patterns. Provide a report with trend analysis and predictive insights (e.g., linear regression, time series forecasting) to support future planning and strategy.
- Ad-hoc Analysis and Data Queries
Deliverable: Custom Data Reports and SQL Queries
Description: Respond to ad-hoc data requests with tailored reports and SQL queries to address specific business questions. Deliver clean, well-documented query scripts and summary reports that directly answer the queries.
- Data Visualization and Reporting
Deliverable: Visual Reports and Presentations
Description: Create clear, insightful visualizations (charts, graphs, infographics) to communicate complex data findings in a digestible format. Deliver presentations or reports with visuals that help stakeholders quickly understand and act on the data insights.
Arsal's other services
$10