
Data Cleaning, Visualization & Business InsightsAteeb Mahedvi
I help businesses turn raw data into decisions with interactive dashboards and clean, actionable insights. Using Power BI, Tableau, SQL, Python and Excel, I design solutions that are visually stunning, easy to use, and tailored to your unique needs. Fast, precise, and client-focused—I make your data work for you.
What's included
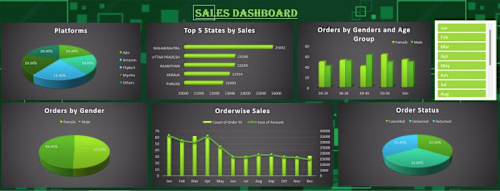
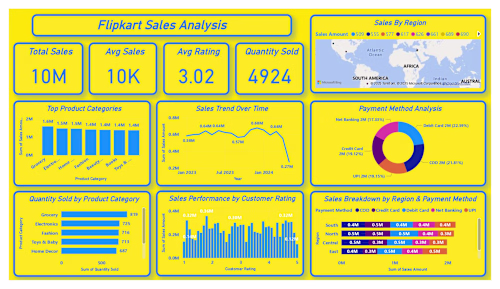
Interactive Dashboard
A fully interactive dashboard built with Power BI, Tableau, or Excel to visualize your data and track KPIs in real time.
Cleaned & Organized Dataset
A structured and error-free dataset (Excel/CSV) ready for analysis and reporting.
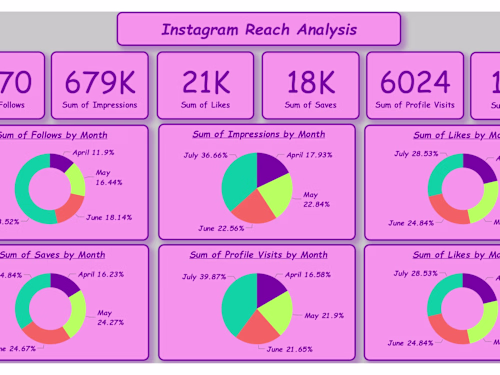
Data Visualizations
Professionally designed charts, graphs, and KPIs to make complex data easy to understand.
Summary Report with Insights
A PDF report summarising key findings, trends, and actionable recommendations to support business decisions.
Source Files & Minor Revisions
Fully editable source files of dashboards and support for minor changes post-delivery.
FAQs
Contact for pricing
Tags
Microsoft Excel
Microsoft Power BI
Python
SQL
Tableau
Data Analyst
Data Modelling Analyst
Data Visualizer
Service provided by
Ateeb Mahedvi Pune, India
- 3
- Followers
Data Cleaning, Visualization & Business InsightsAteeb Mahedvi
Contact for pricing
Tags
Microsoft Excel
Microsoft Power BI
Python
SQL
Tableau
Data Analyst
Data Modelling Analyst
Data Visualizer
I help businesses turn raw data into decisions with interactive dashboards and clean, actionable insights. Using Power BI, Tableau, SQL, Python and Excel, I design solutions that are visually stunning, easy to use, and tailored to your unique needs. Fast, precise, and client-focused—I make your data work for you.
What's included
Interactive Dashboard
A fully interactive dashboard built with Power BI, Tableau, or Excel to visualize your data and track KPIs in real time.
Cleaned & Organized Dataset
A structured and error-free dataset (Excel/CSV) ready for analysis and reporting.
Data Visualizations
Professionally designed charts, graphs, and KPIs to make complex data easy to understand.
Summary Report with Insights
A PDF report summarising key findings, trends, and actionable recommendations to support business decisions.
Source Files & Minor Revisions
Fully editable source files of dashboards and support for minor changes post-delivery.
FAQs
Contact for pricing