
Reports for your Company 📊 - Make Data-Driven DecisionsTristan Pahud
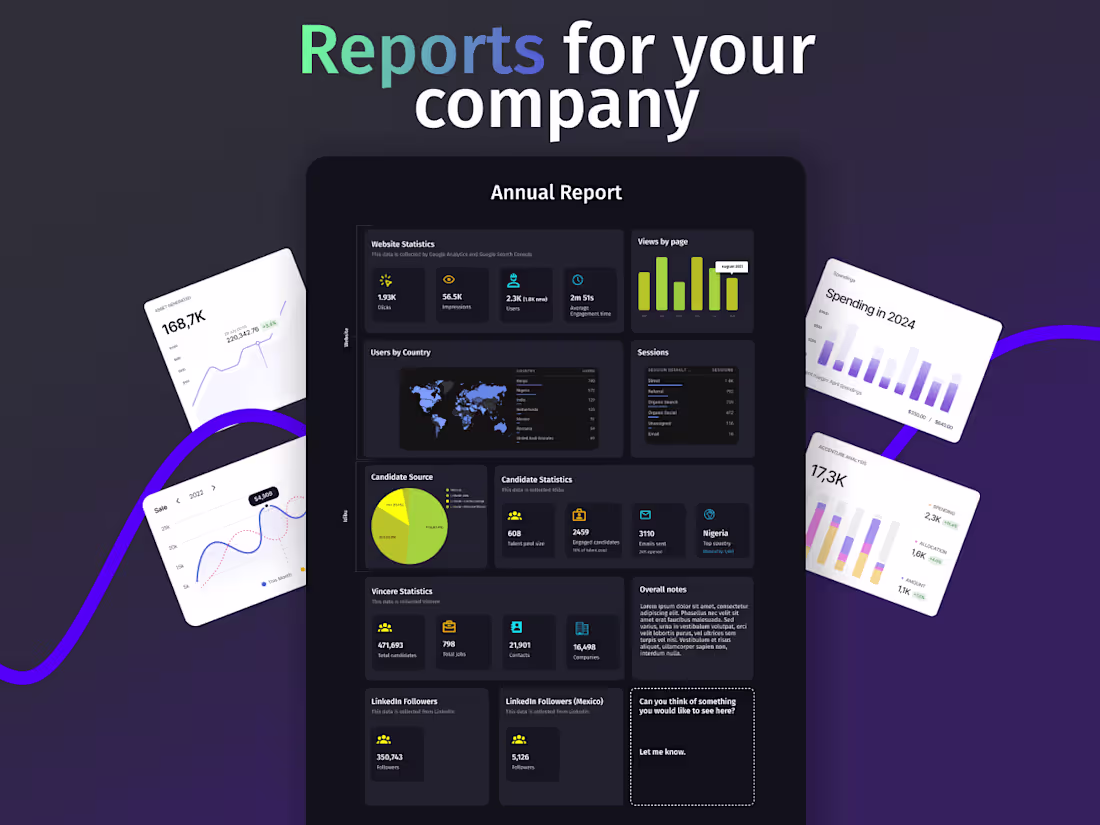
I offer comprehensive reporting services designed to help businesses make data-driven decisions. By consolidating key performance indicators (KPIs), web analytics, financial data, and other important metrics from various channels, I deliver clear, actionable reports on a weekly, monthly, or yearly basis. My service includes custom data reports, trend analysis, executive summaries, and interactive dashboards, all tailored to the specific needs of the company. With my reports, businesses can visualize trends, optimize performance, and confidently plan their next steps based on well-organized insights.
What's included
Custom Data Reports
Weekly, monthly, or yearly reports consolidating KPIs, analytics, financial data, and key insights from various data channels like Google Analytics, social media, and CRM systems. These reports present all essential metrics in an easy-to-understand format, enabling data-driven decision-making.
Trend Analysis
In-depth analysis of trends across multiple data sources, identifying growth opportunities, performance gaps, and emerging patterns. This helps businesses stay ahead by recognizing changes in key metrics early on.
Executive Summary
A concise, high-level overview of the most important data points and actionable insights, tailored for stakeholders who need to quickly understand performance without delving into granular details.
Visualization Dashboards
Interactive dashboards that provide real-time data visualization, allowing companies to track performance metrics at a glance. These dashboards can be integrated into business systems for easy access by team members.
Comparative Performance Analysis
Comparison of data across different time periods, markets, or channels to highlight trends, successes, and areas needing improvement. This helps businesses benchmark performance and refine strategies.
Recommendations for Optimization
Data-driven recommendations on how to optimize marketing, sales, or operational strategies based on the insights gathered from reports. This could include improving campaign performance, enhancing user experience, or adjusting financial priorities.
Tristan's other services

Starting at$250 /wk
Tags
Facebook Ads
Figma
Google Ads
Google Analytics
SEMrush
Data Analyst
Service provided by
Tristan Pahud Amsterdam, Netherlands
- $1k+
- Earned
- 2
- Paid projects
- 5.00
- Rating
- 35
- Followers
Reports for your Company 📊 - Make Data-Driven DecisionsTristan Pahud
Starting at$250 /wk
Tags
Facebook Ads
Figma
Google Ads
Google Analytics
SEMrush
Data Analyst
I offer comprehensive reporting services designed to help businesses make data-driven decisions. By consolidating key performance indicators (KPIs), web analytics, financial data, and other important metrics from various channels, I deliver clear, actionable reports on a weekly, monthly, or yearly basis. My service includes custom data reports, trend analysis, executive summaries, and interactive dashboards, all tailored to the specific needs of the company. With my reports, businesses can visualize trends, optimize performance, and confidently plan their next steps based on well-organized insights.
What's included
Custom Data Reports
Weekly, monthly, or yearly reports consolidating KPIs, analytics, financial data, and key insights from various data channels like Google Analytics, social media, and CRM systems. These reports present all essential metrics in an easy-to-understand format, enabling data-driven decision-making.
Trend Analysis
In-depth analysis of trends across multiple data sources, identifying growth opportunities, performance gaps, and emerging patterns. This helps businesses stay ahead by recognizing changes in key metrics early on.
Executive Summary
A concise, high-level overview of the most important data points and actionable insights, tailored for stakeholders who need to quickly understand performance without delving into granular details.
Visualization Dashboards
Interactive dashboards that provide real-time data visualization, allowing companies to track performance metrics at a glance. These dashboards can be integrated into business systems for easy access by team members.
Comparative Performance Analysis
Comparison of data across different time periods, markets, or channels to highlight trends, successes, and areas needing improvement. This helps businesses benchmark performance and refine strategies.
Recommendations for Optimization
Data-driven recommendations on how to optimize marketing, sales, or operational strategies based on the insights gathered from reports. This could include improving campaign performance, enhancing user experience, or adjusting financial priorities.
Tristan's other services
$250 /wk