
Fantastic dashboard with Microsoft Excel (secret technique)Francesco Stara
I create high quality Excel dashboards that prove Excel is much more than just spreadsheets—it's a smart choice for business intelligence, just like the fancy tools, but simpler and without extra costs.
What's special about my service is that these dashboards are not only powerful in showing you what you need to know about your business but are also made to be easily changed by you, if needed, whenever you want.
It's smart, flexible, and keeps you in control.
What's included
Customized Excel Dashboard
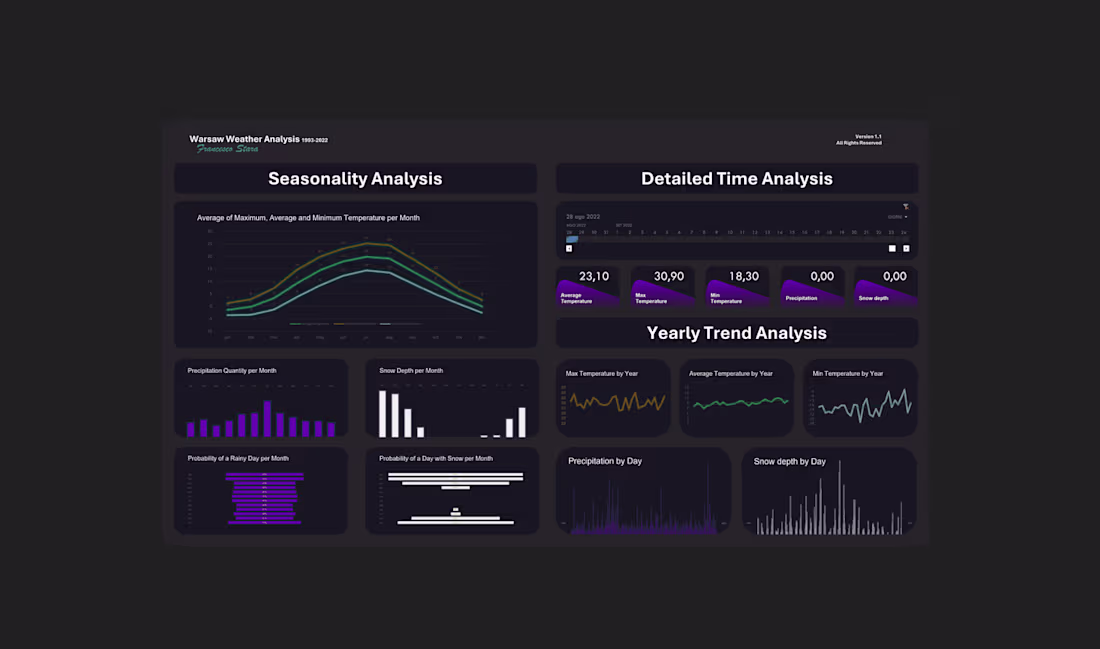
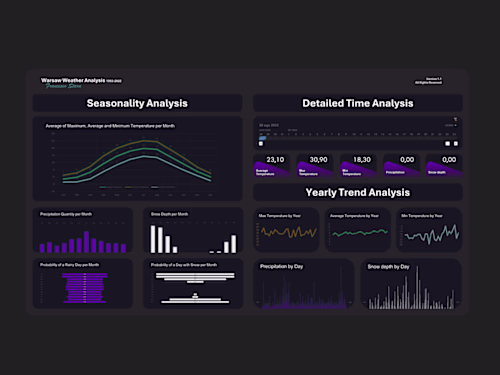
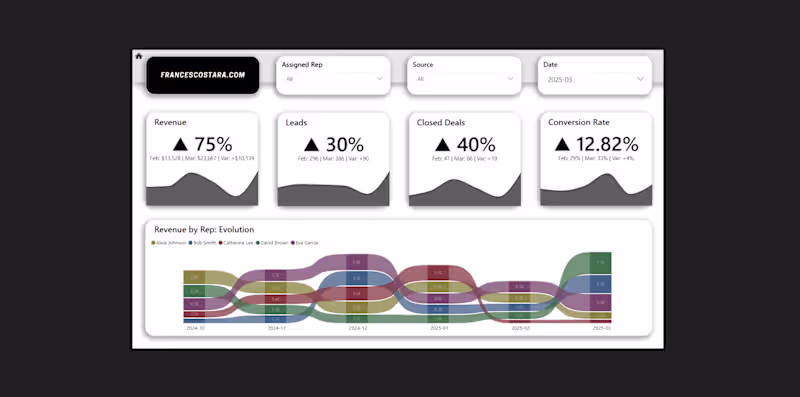
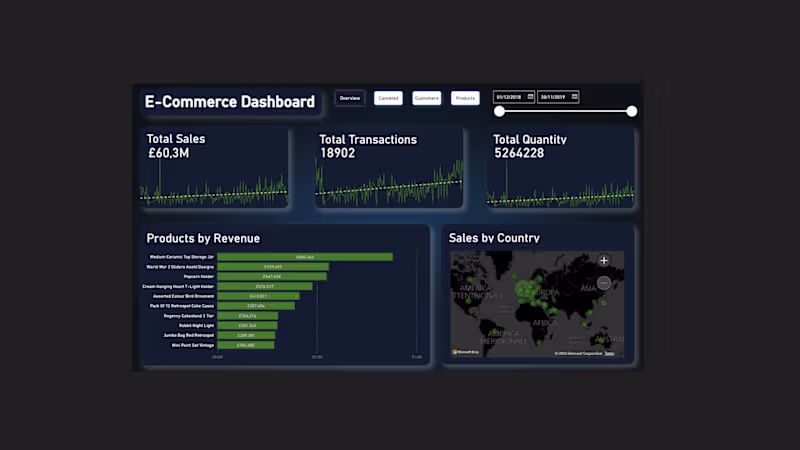
A tailor-made Excel dashboard that visually displays key performance indicators (KPIs), metrics, and other important data points specific to your business needs.
This interactive tool will allow you to filter, sort, and analyze their data in real-time, facilitating quicker decision-making and insights.
Training Session (live or recorded video tutorial) + User manual
Offer a training session (either live or pre-recorded) that guides you on how to use the dashboard effectively, including how to update data, interpret results, and customize views.
Also, provide a detailed user manual or documentation that serves as a reference guide for navigating and maintaining the dashboard.
Starting at$300
Duration2 weeks
Tags
Microsoft Excel
Python
Data Analyst
Data Modelling Analyst
Data Visualizer
Service provided by
Francesco Stara Warsaw, Poland
- 21
- Followers
Fantastic dashboard with Microsoft Excel (secret technique)Francesco Stara
Starting at$300
Duration2 weeks
Tags
Microsoft Excel
Python
Data Analyst
Data Modelling Analyst
Data Visualizer
I create high quality Excel dashboards that prove Excel is much more than just spreadsheets—it's a smart choice for business intelligence, just like the fancy tools, but simpler and without extra costs.
What's special about my service is that these dashboards are not only powerful in showing you what you need to know about your business but are also made to be easily changed by you, if needed, whenever you want.
It's smart, flexible, and keeps you in control.
What's included
Customized Excel Dashboard
A tailor-made Excel dashboard that visually displays key performance indicators (KPIs), metrics, and other important data points specific to your business needs.
This interactive tool will allow you to filter, sort, and analyze their data in real-time, facilitating quicker decision-making and insights.
Training Session (live or recorded video tutorial) + User manual
Offer a training session (either live or pre-recorded) that guides you on how to use the dashboard effectively, including how to update data, interpret results, and customize views.
Also, provide a detailed user manual or documentation that serves as a reference guide for navigating and maintaining the dashboard.
$300