
Data Analysis & Insights in Excel or Power BIDarren Pierson
I help businesses turn raw data into clear, actionable insights using Excel and Power BI. With 15+ years of data analysis experience, I deliver structured reports, interactive visuals, and easy-to-understand takeaways that support confident decision-making.
What's included
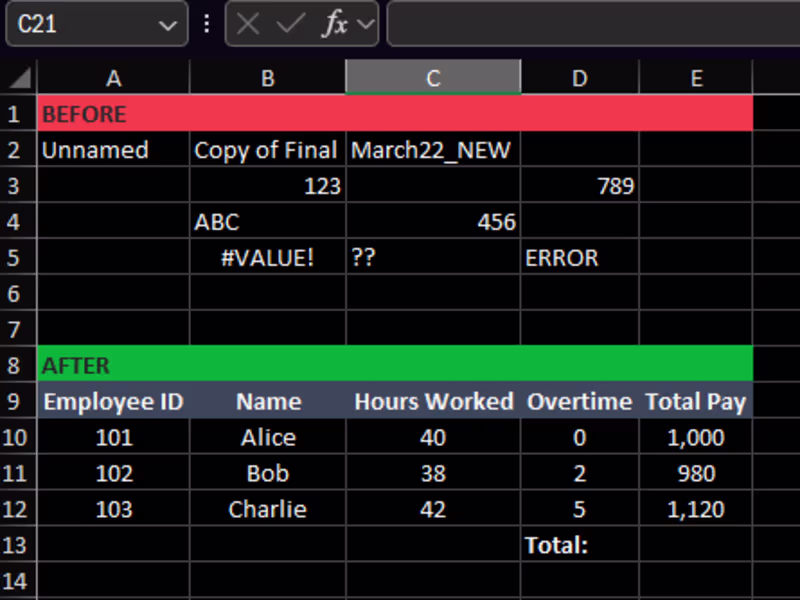
Data Cleaning & Preparation
Your dataset will be reviewed, cleaned, and structured for accuracy and consistency, ensuring it’s ready for analysis.
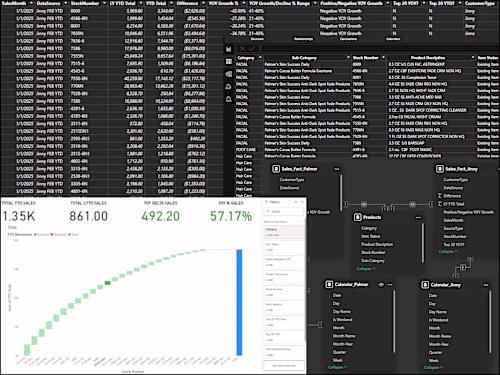
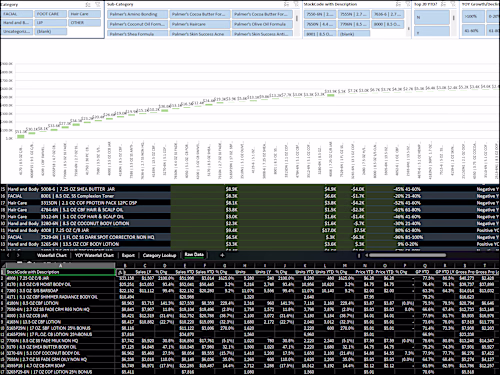
Data Analysis & Key Findings
Clear analysis of your data with tables, metrics, and trend identification, highlighting the most important insights.
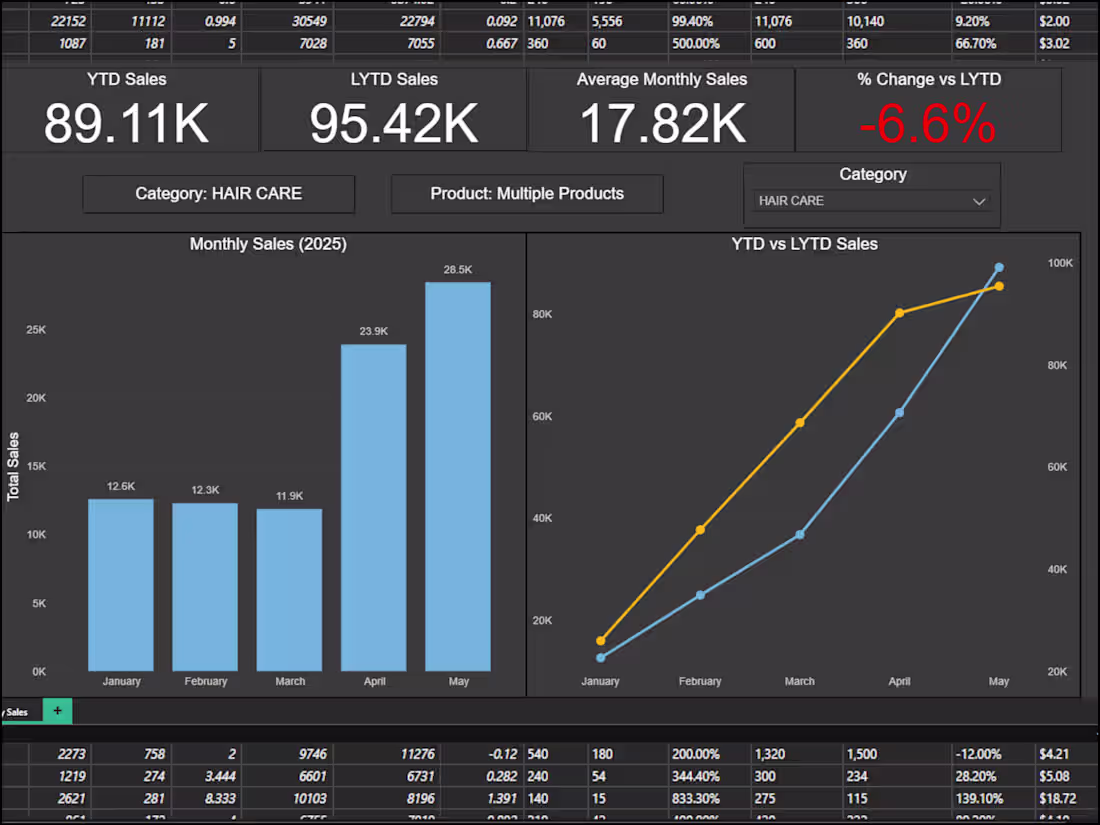
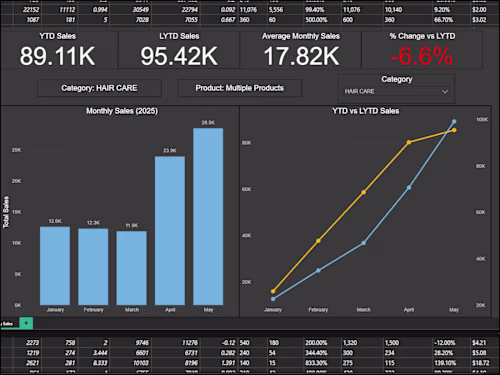
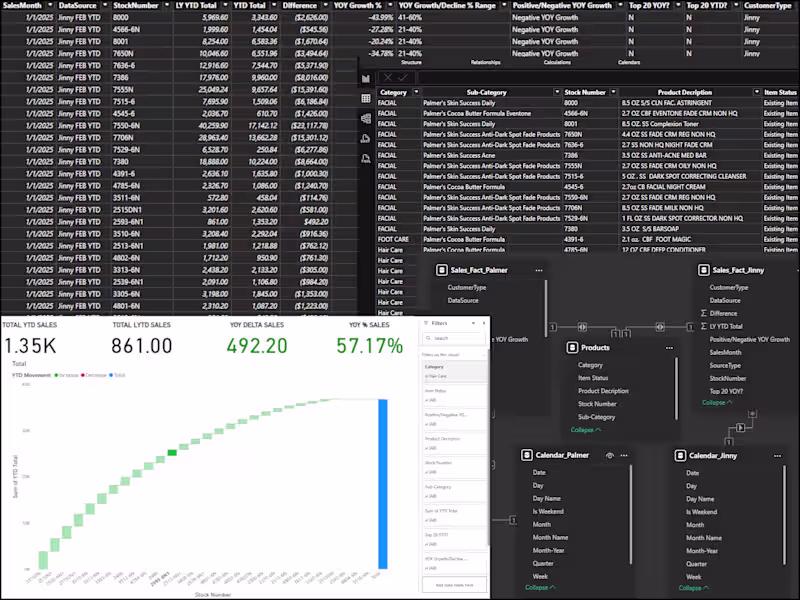
Visual Reports (Excel or Power BI)
Custom charts, visuals, and summaries presented in Excel or Power BI for easy interpretation of results.
Summary Report of Insights
A short written summary highlighting trends, anomalies, and recommendations for decision-making.
FAQs
Example work
Starting at$100
Duration1 week
Tags
Clean Spreadsheets
Excel VBA
Microsoft Excel
Microsoft Power BI
Business Analyst
Data Analyst
Financial Analyst
Service provided by
Darren Pierson Wildwood, USA
- 12
- Followers
Data Analysis & Insights in Excel or Power BIDarren Pierson
Starting at$100
Duration1 week
Tags
Clean Spreadsheets
Excel VBA
Microsoft Excel
Microsoft Power BI
Business Analyst
Data Analyst
Financial Analyst
I help businesses turn raw data into clear, actionable insights using Excel and Power BI. With 15+ years of data analysis experience, I deliver structured reports, interactive visuals, and easy-to-understand takeaways that support confident decision-making.
What's included
Data Cleaning & Preparation
Your dataset will be reviewed, cleaned, and structured for accuracy and consistency, ensuring it’s ready for analysis.
Data Analysis & Key Findings
Clear analysis of your data with tables, metrics, and trend identification, highlighting the most important insights.
Visual Reports (Excel or Power BI)
Custom charts, visuals, and summaries presented in Excel or Power BI for easy interpretation of results.
Summary Report of Insights
A short written summary highlighting trends, anomalies, and recommendations for decision-making.
FAQs
Example work
$100