
Data Visualization and Data Analysis using TableauAngelin
I am offering data visualization services that transform complex data into actionable insights, using tools like Tableau to create interactive dashboards and reports. What sets me apart is my expertise in crafting clear and concise visualizations that facilitate easy understanding and decision-making, ensuring that clients can effectively communicate their findings to stakeholders and drive business growth.
What's included
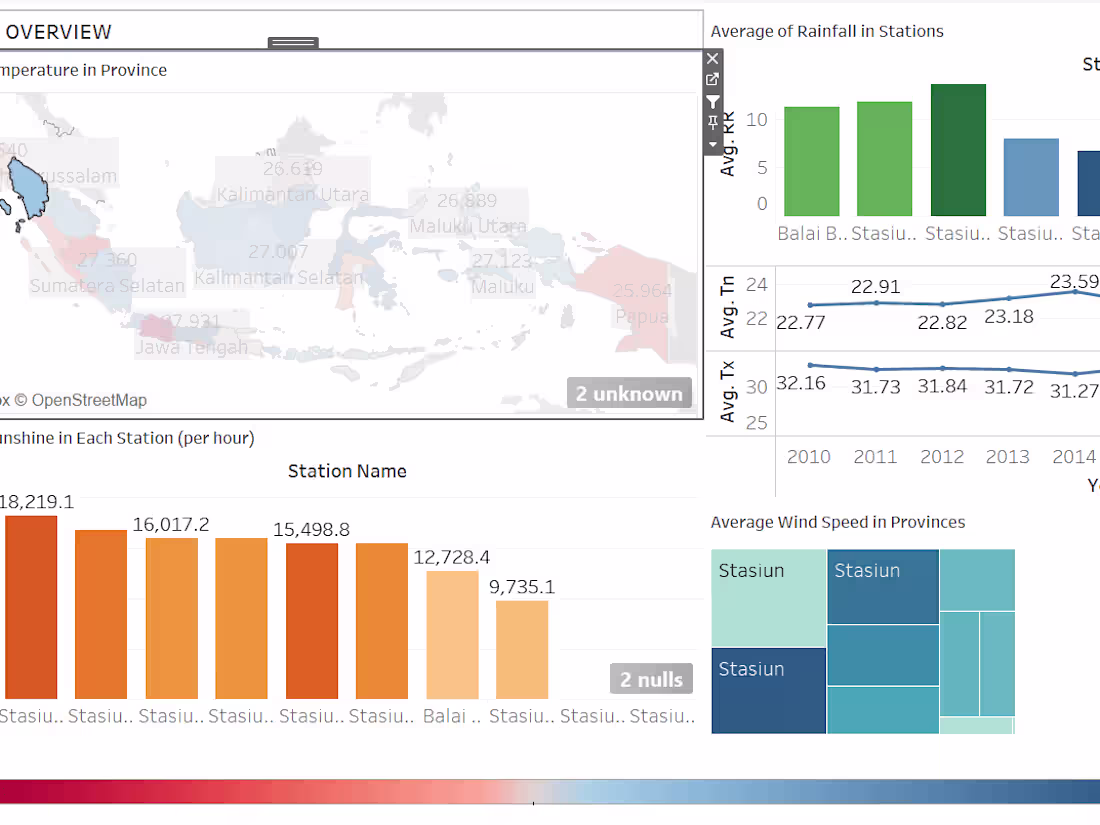
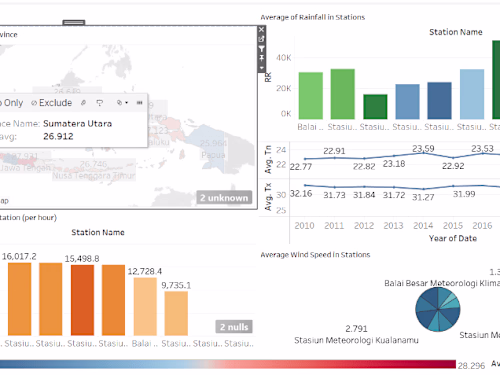
Data Visualization Interactive Dashboard
An interactive data visualization dashboard that provides real-time updates and insights into key performance indicators (KPIs) and trends.
Format: Tableau Workbook (.Twb or .Twbx)
Quantity: 1
Revisions: 1
Additional Details: The dashboard will be designed to be user-friendly and accessible, with clear labels and intuitive navigation. It will include interactive visualizations and filters to allow for easy exploration and analysis of the data.
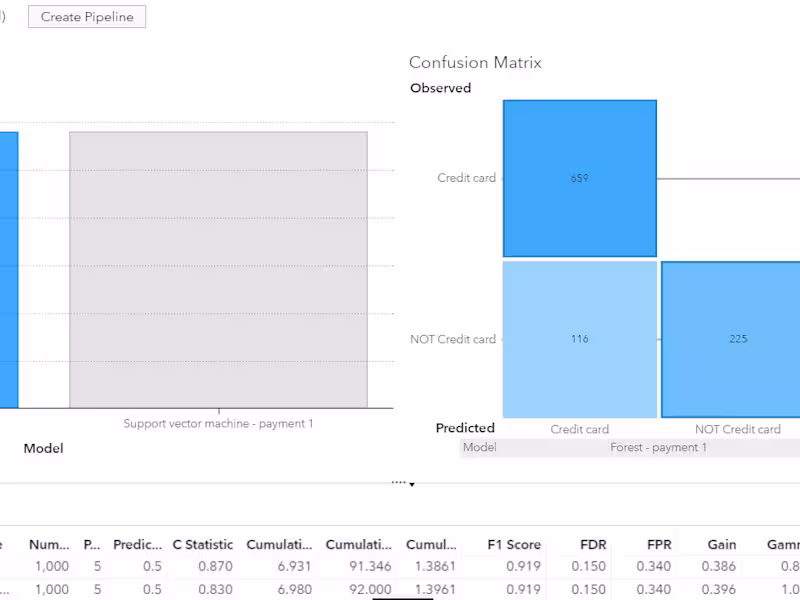
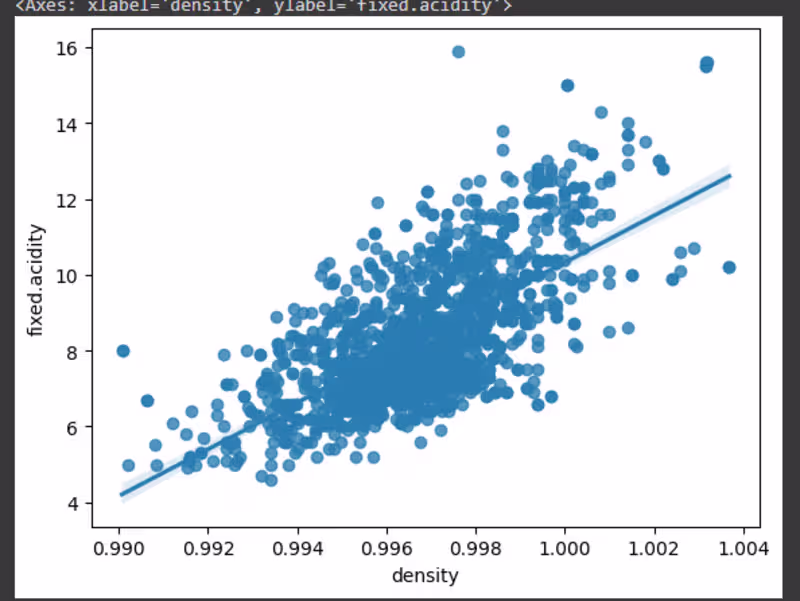
Data Visualization Report
A comprehensive data visualization report that transforms your data into actionable insights, providing a clear and concise overview of key trends, patterns, and correlations.
Format: PDF
Quantity: 1
Revisions: 1
Additional Details: The report will include interactive visualizations using Tableau, highlighting key findings and insights, and will be designed to facilitate easy understanding and decision-making.
Data Visualization Presentation
A presentation summarizing the key findings and insights from the data visualization project, designed to effectively communicate the results to stakeholders and decision-makers.
Format: PowerPoint
Quantity: 1
Revisions: 1
Additional Details: The presentation will include clear and concise slides, with visualizations and charts to support the key findings. It will be designed to be engaging and easy to follow, with a focus on conveying the insights and recommendations in a clear and actionable manner.
Starting at$35
Duration12 days
Tags
Google Analytics
Jupyter
Matplotlib
Python
Tableau
Data Analyst
Data Scientist
Data Visualizer
Service provided by
Angelin Jakarta, Indonesia
Data Visualization and Data Analysis using TableauAngelin
Starting at$35
Duration12 days
Tags
Google Analytics
Jupyter
Matplotlib
Python
Tableau
Data Analyst
Data Scientist
Data Visualizer
I am offering data visualization services that transform complex data into actionable insights, using tools like Tableau to create interactive dashboards and reports. What sets me apart is my expertise in crafting clear and concise visualizations that facilitate easy understanding and decision-making, ensuring that clients can effectively communicate their findings to stakeholders and drive business growth.
What's included
Data Visualization Interactive Dashboard
An interactive data visualization dashboard that provides real-time updates and insights into key performance indicators (KPIs) and trends.
Format: Tableau Workbook (.Twb or .Twbx)
Quantity: 1
Revisions: 1
Additional Details: The dashboard will be designed to be user-friendly and accessible, with clear labels and intuitive navigation. It will include interactive visualizations and filters to allow for easy exploration and analysis of the data.
Data Visualization Report
A comprehensive data visualization report that transforms your data into actionable insights, providing a clear and concise overview of key trends, patterns, and correlations.
Format: PDF
Quantity: 1
Revisions: 1
Additional Details: The report will include interactive visualizations using Tableau, highlighting key findings and insights, and will be designed to facilitate easy understanding and decision-making.
Data Visualization Presentation
A presentation summarizing the key findings and insights from the data visualization project, designed to effectively communicate the results to stakeholders and decision-makers.
Format: PowerPoint
Quantity: 1
Revisions: 1
Additional Details: The presentation will include clear and concise slides, with visualizations and charts to support the key findings. It will be designed to be engaging and easy to follow, with a focus on conveying the insights and recommendations in a clear and actionable manner.
$35