
Ryan Tennis
Data analyst turning real-world questions into answers
Ready for work
Ryan is ready for their next project!
In 2024, as a Senior Research Analyst at Modesto Junior College, I built this Course Modality dashboard in Power BI to help administrators compare enrollment and student success across formats like F2F, online, hybrid, and HyFlex.
The dashboard breaks results down by gender, race/ethnicity, age range, and first-gen status, and can be filtered by term, school, course, and modality. Users can toggle between success and retention rates to see where different groups are doing well or need more support. It’s now used in program review and planning to guide decisions about scheduling and modality mix.
Link: https://app.powerbi.com/view?r=eyJrIjoiMGQ4ZDc2NjYtZTg1MC00YWZmLTlmMzktNTRmNzYwMWFiNDAzIiwidCI6IjNkMzVhZmU2LTI2YWMtNDM3ZS1iNGIzLTc1YjUwZDQ1OWU0NSIsImMiOjZ9
16
214
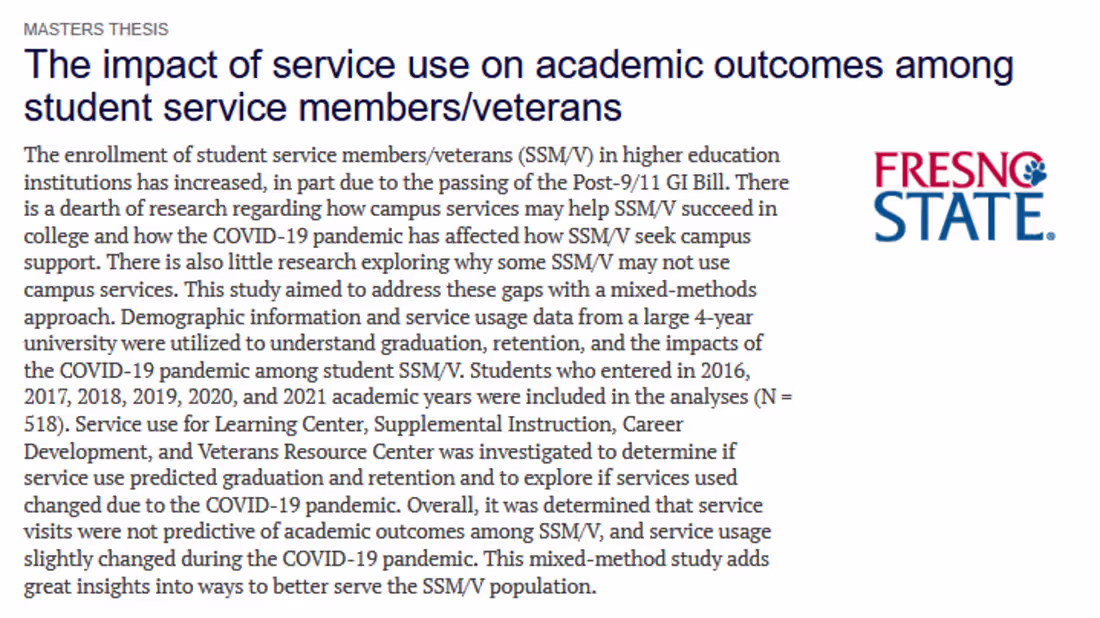
Mixed-Methods Study on Student Veterans:
THE IMPACT OF SERVICE USE ON ACADEMIC OUTCOMES AMONG STUDENT SERVICE MEMBERS/VETERANS
Link: https://scholarworks.calstate.edu/concern/theses/8g84mt80m
0
118
In 2024, while working as a Senior Research Analyst at Modesto Junior College, I built this Program Enrollment by Zip Code dashboard in Power BI to help leadership and outreach staff see where students live across the region and how that changes over time.
I pulled enrollment data from our student system, aggregated it at the program and ZIP code level, and joined it with spatial data so we could map enrollment by county and neighborhood. Filters allow users to slice by year, city, and ZIP code, with a privacy threshold hiding ZIP codes with very few students.
Deans and outreach staff use this dashboard to spot growth or decline and plan recruiting and marketing efforts.
Link http://app.powerbi.com/view?r=eyJrIjoiZmYzMGVlNjAtNzc5OS00ZWU4LWJjZjAtNTAyNzEyMmRlYjM0IiwidCI6IjNkMzVhZmU2LTI2YWMtNDM3ZS1iNGIzLTc1YjUwZDQ1OWU0NSIsImMiOjZ9
1
19
235

In 2023–2024, I co-led the qualitative analysis for Pacific’s HEDS DEI Campus Climate Survey. I helped design the coding framework for several open-ended items on sense of community and experiences with discrimination and harassment, set up the project in Dedoose, and worked through multiple rounds of coding to keep themes consistent across coders. I then helped turn those coded themes into a clear written summary and simple visuals for campus leadership. Our qualitative report was one of the inputs that partly informed the 2024–27 Diversity Action Plan, and the climate summary in Appendix D reflects the structure and themes from this analysis.
Link to UOP's Diversity Action Plan: https://www.pacific.edu/sites/default/files/DEI/Diversity%20Action%20Plan%202024-27.pdf
18
219
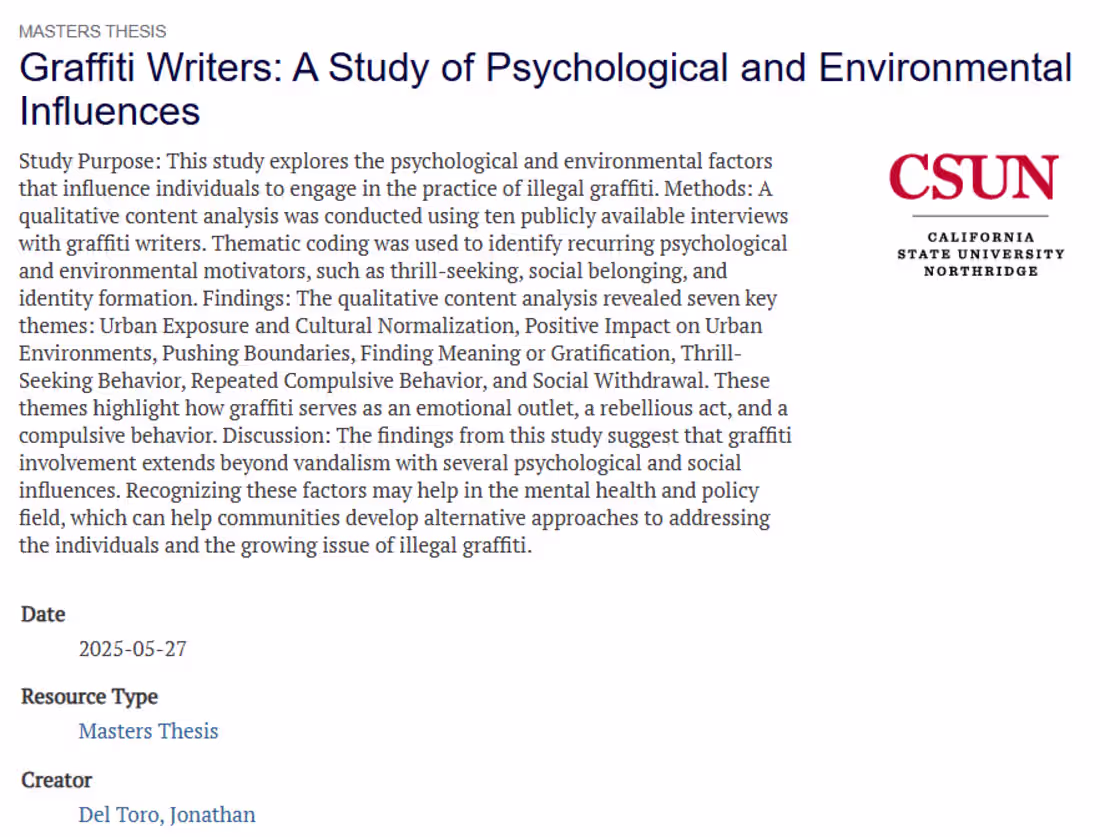
I served as a qualitative methods coach for Jonathan Del Toro’s MSW thesis, “Graffiti Writers: A Study of Psychological and Environmental Influences,” at CSU Northridge. The project and findings are entirely his; my role was to help him learn and apply rigorous qualitative techniques. I worked with him to build an initial coding tree, set up and use Dedoose for content analysis, and refine codes and memos as themes emerged. The goal was to strengthen the reliability and clarity of his analysis while ensuring he remained the primary researcher and author.
Graffiti Writers: A Study of Psychological and Environmental Influences by Jonathan Del Toro
Link: https://scholarworks.calstate.edu/concern/theses/zk51vs86f
11
150