
rehan ali haider
Data Analyst | AI Automation & Agent Builder
New to Contra
rehan ali is building their profile!

I built a complete AI automation system for barbershops in ONE day. Here's exactly what it does,
Most barbershop owners are losing money every single day.
Missed calls. No-shows. Customers who never come back. Not because their service is bad. Because they have zero systems.
So I built one for them.
Here's the full stack:
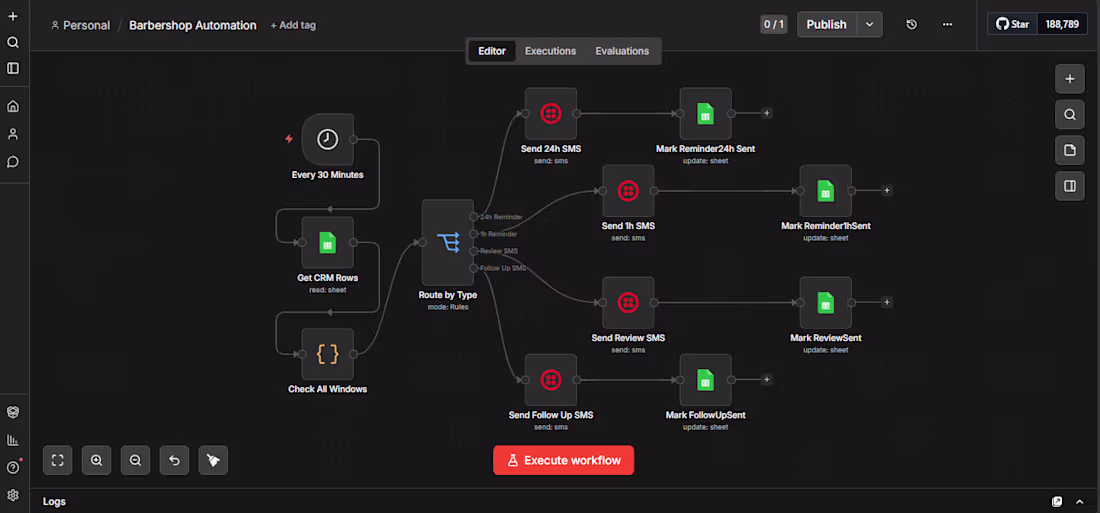
𝗕𝗟𝗢𝗖𝗞 𝟭 — AI RECEPTIONIST 📞 Powered by VAPI. Answers every call 24/7. Books. Reschedules. Cancels. Saves every customer's name, number, and appointment to a CRM automatically. Sends the owner a Gmail notification instantly. The owner doesn't touch anything.
𝗕𝗟𝗢𝗖𝗞 𝟮 — SMART REMINDERS ⏰ 24 hours before the appointment → customer gets an SMS reminder. 1 hour before → another SMS. System never sends twice. Never spams. Fully automated. No-shows drop. Revenue stays.
𝗕𝗟𝗢𝗖𝗞 𝟯 — REVIEW MACHINE ⭐ 24 hours after the appointment → customer gets a text asking for a Google review. More reviews = higher Google ranking = more walk-ins. Most barbershops beg for reviews manually. This does it automatically every single time.
𝗕𝗟𝗢𝗖𝗞 𝟰 — BRING THEM BACK 🔄 2 weeks after their last cut → customer gets a follow-up SMS. "Hey [Name], ready for a fresh one? Book here." One message. Brings them back without the owner lifting a finger.
The result?
✅ Never miss a call again
✅ Fewer no-shows
✅ More 5-star reviews on autopilot
✅ Customers keep coming back
✅ Owner just shows up and cuts hair
This is not a concept. This is built. This is running.
Tech stack: VAPI • n8n • Twilio • Google Sheets • Google Calendar • Apps Script
I'm building this in public. Every block. Every mistake. Every win.
If you own a local business or know someone who does, this is what automation actually looks like in 2026.
What would YOU want if you owned a barbershop?
What's missing?
What would make you pay for this monthly?
Drop it in the comments 👇 Building this in public and every suggestion counts.
0
20
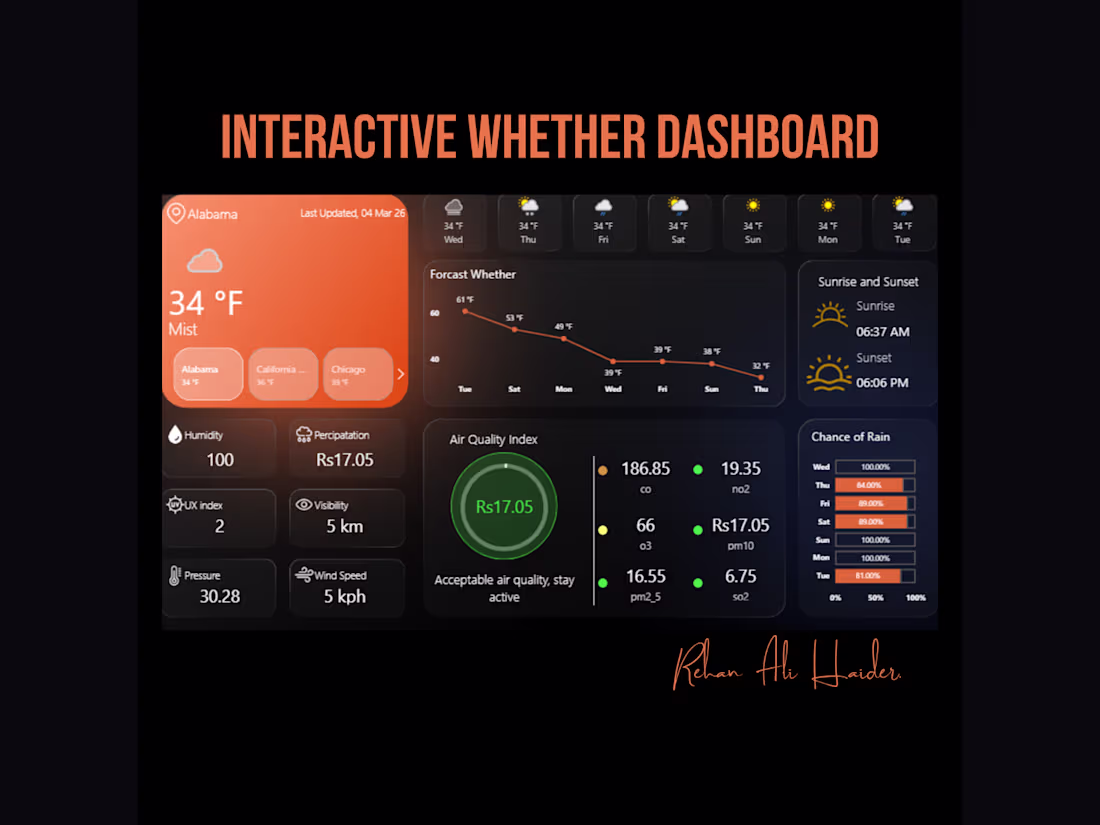
Created an Interactive Weather Dashboard using Power BI and it doesn't even resemble what Power BI can usually create.
Dark mode, orange highlights, authentic weather app look & feel. All this dashboard does is display live weather information for multiple locations with all information at once.
Features Include:
Real-time weather status including temperature, humidity, wind speed, UV Index, visibility and pressure
7-day forecast with temperature trends line
Air quality index with detailed pollutant composition (Carbon Monoxide, Nitrogen Dioxide, Ozone, Particulate Matter, Sulfur dioxide)
Sun rise & sun set times
Chance of precipitation with clear horizontal bars
This is how Power BI can perform tasks which are beyond expectations from Power BI itself.
#PowerBI #DataVisualization #Dashboard #DataAnalytics #DataAnalyst #WeatherDashboard
0
86
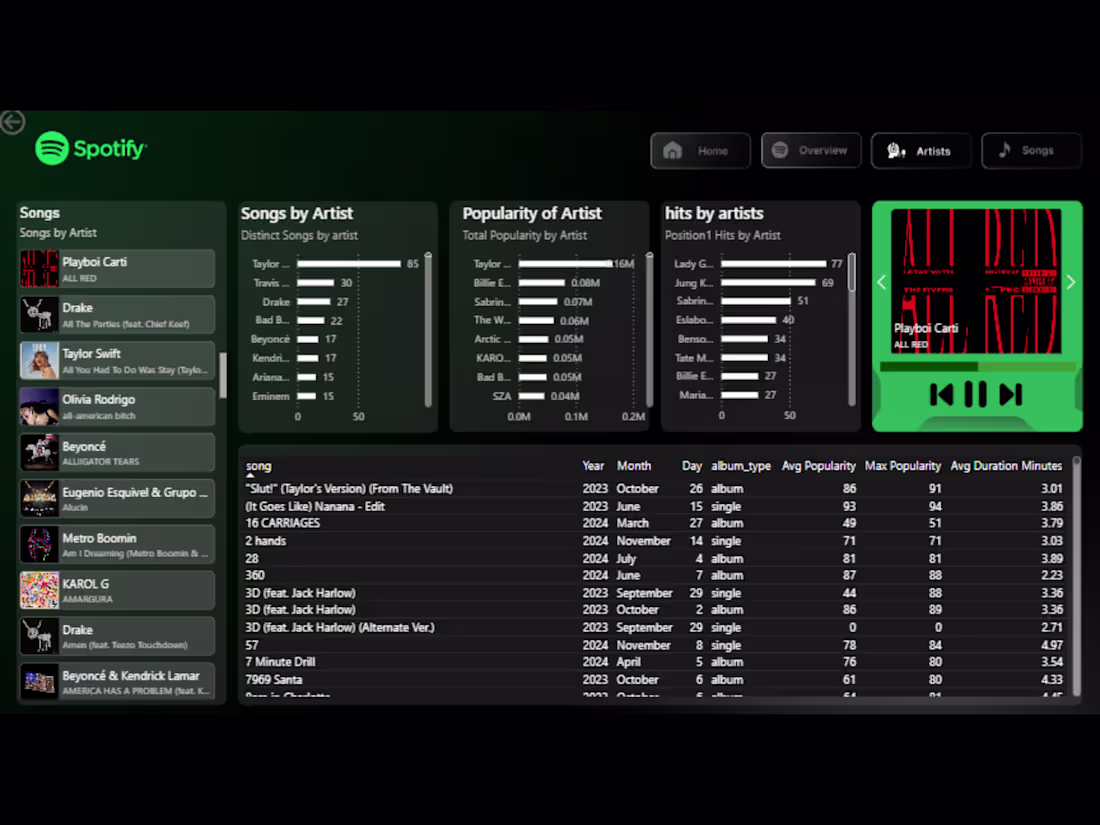
Created a Spotify dashboard using Power BI – and no, it does look like Spotify.
Four interactive dashboards, Home, Overview, Artists, and Songs. Using dark mode, Spotify branding, album covers, and even an interactive music player interface – all using Power BI.
Contents include:
789 unique songs analyzed for the period 2023 to 2024
Top artists by number of songs, popularity, and songs that reached position one
Explicit songs vs. non-explicit songs analysis, split between albums and singles
Monthly average popularity trend and quarterly average popularity trend
Interactive drill-down song data with duration, popularity, and album information
Taylor Swift tops the charts with 85 songs. “I Want It That Way” gets up to 51K in popularity. No denying the facts.
When data meets aesthetics.
#PowerBI #DataAnalytics #SpotifyDashboard #DataVisualization #DataAnalyst #Dashboard
0
94
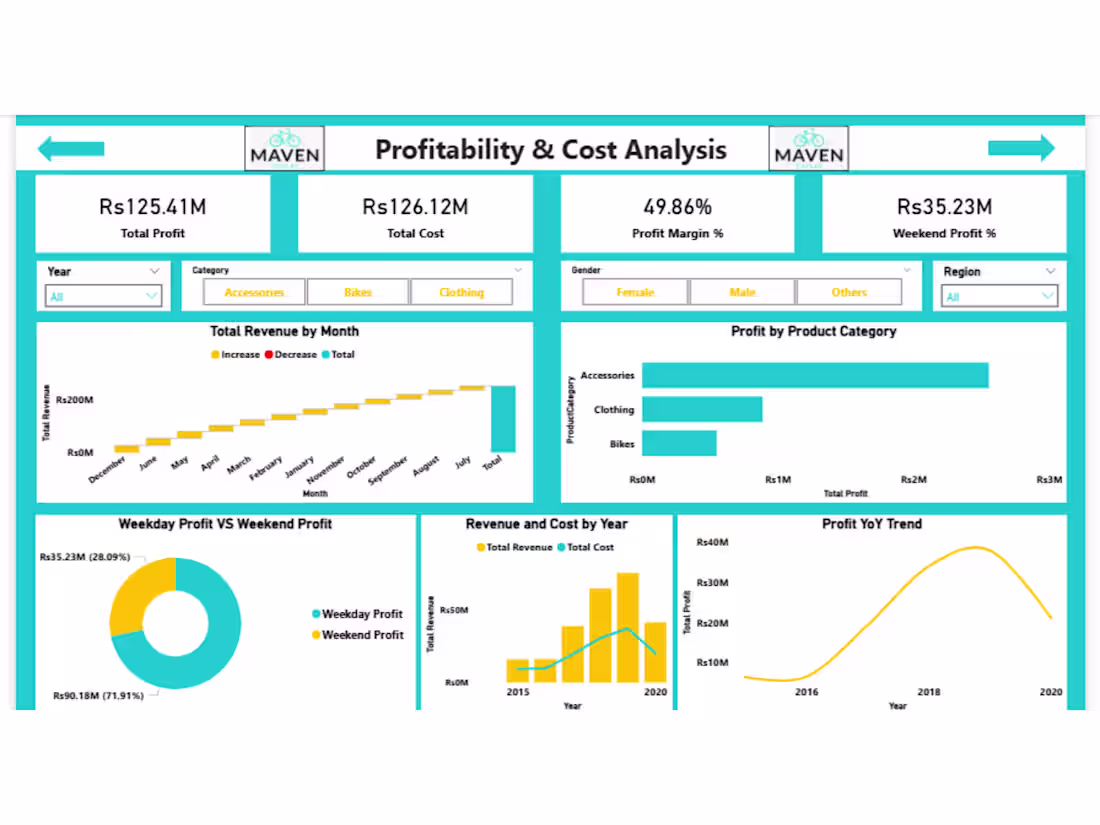
Created a complete Power BI Sales Dashboard for Maven Cycles – a bicycle manufacturer earning revenues of Rs251.54M through 163K sales transactions.
Analysis of 4 pages including – Executive Overview, Time Intelligence & Trend Analysis, Profitability & Cost Analysis, and Sales & Revenue Performance.
Included within:
Profit of Rs125.41M with 49.86% profit margin on Bikes, Accessories & Clothing.
Monthly revenue trends along with MoM% and YoY% calculations and complete Time Intelligence.
Market share analysis in 6 countries with the US market contributing 32.62%.
Profit percentage by week days and weekends along with Top & Bottom product ranking.
Revenue and cost analysis from the year 2015 to 2020.
Highest revenue generation by Bikes. Highest profit margins by Accessories.
0
87
I have just created an Interactive Hospital Report in Excel without using any Power BI, only data modeling and dashboard building.
The multi-page report includes data about Patients, Services' Weekly Performance, and Staff Performance, which can be filtered by department, age group, and staff category. All charts will update dynamically according to your choice.
Features:
Number of patients, patient satisfaction, and hospital stay per service
Weekly trend of refusing treatments and admission rate
Distribution of staff, absenteeism, and presentability
Analysis of event influence on admission
That is how clean data and data modeling should look like.
#DataAnalytics #Excel #Dashboard #DataAnalyst #HospitalData #PowerQuery
0
93