
Proud Ndlovu
FinTech Data Analyst | SQL, Python, Power BI
New to Contra
Proud is ready for their next project!
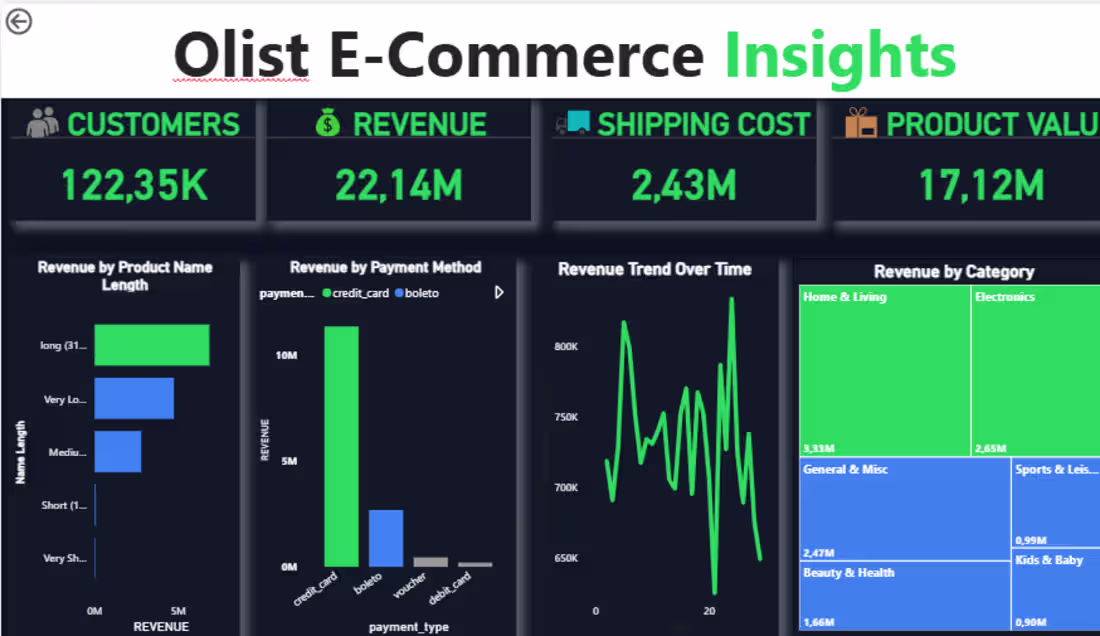
If your e-commerce data is sitting in spreadsheets with no clear visibility into what's driving revenue — this is what I build.
SQL + Power BI dashboard covering 122K customers, 22M revenue, category breakdown, payment trends, and shipping cost analysis.
Open to freelance analytics and dashboard projects. Let's talk.
0
26
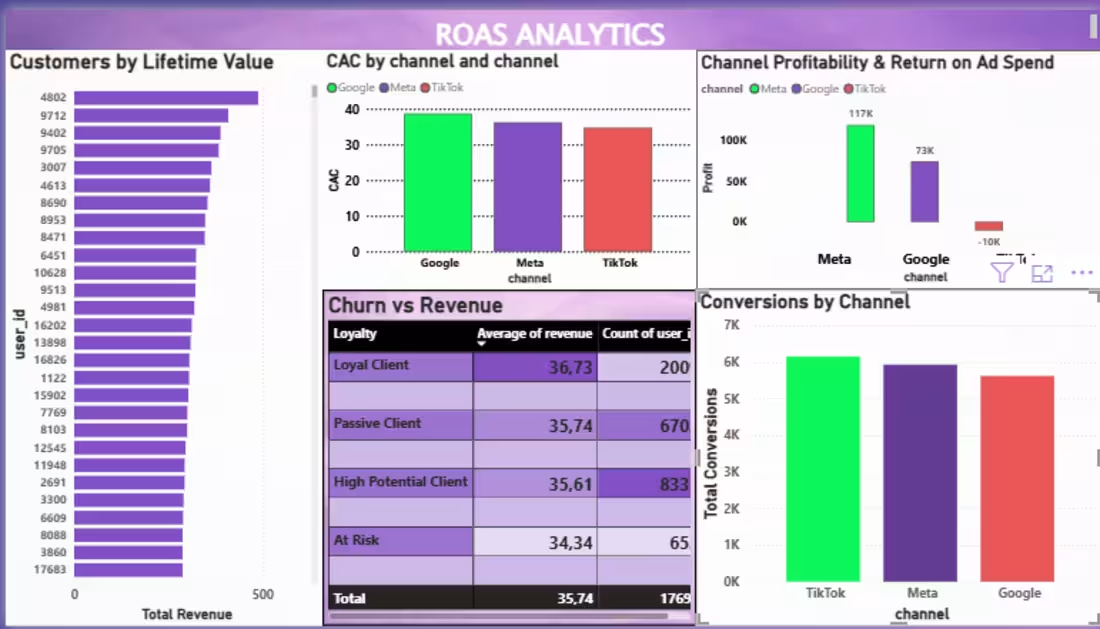
Built a SQL marketing analytics engine across 6 relational tables — computing ROAS, CAC, LTV, and churn probability — projecting 20–25% ROI improvement and eliminating 10+ hours of manual reporting weekly.
0
15
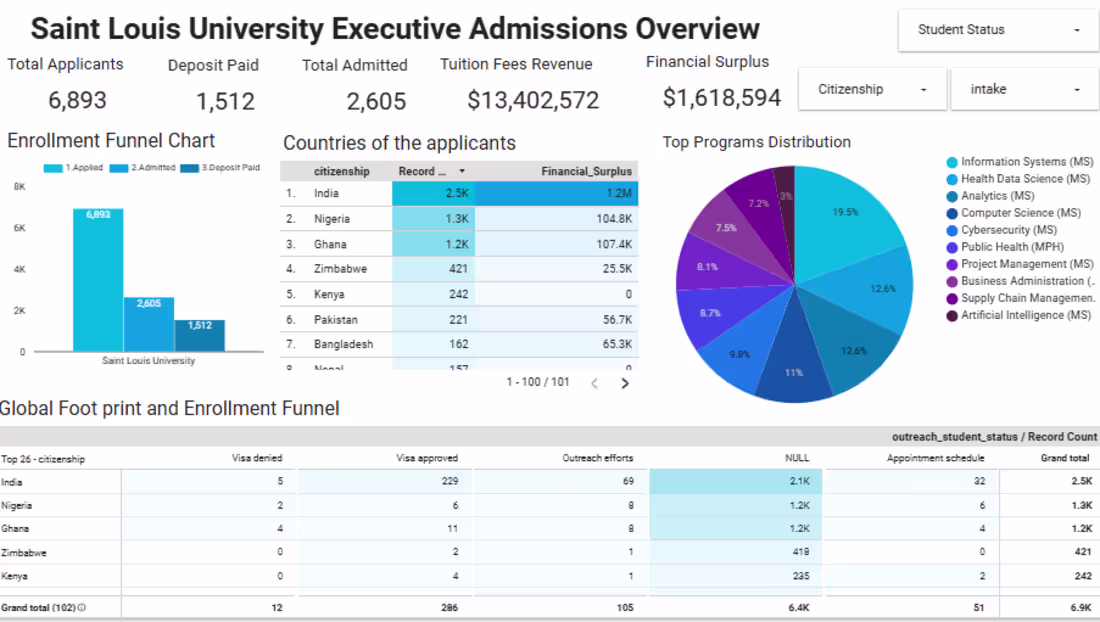
Governed PostgreSQL → Looker Studio admissions pipeline for a US university — 6,800+ records, 100% KPI validated.
0
23
Built a full Python → SQL → Power BI churn analytics pipeline on 10,000 bank customers — identifying a 20.37% churn rate, 2,521 high-risk customers, and 5 major churn drivers with SQL-validated KPIs.
0
30
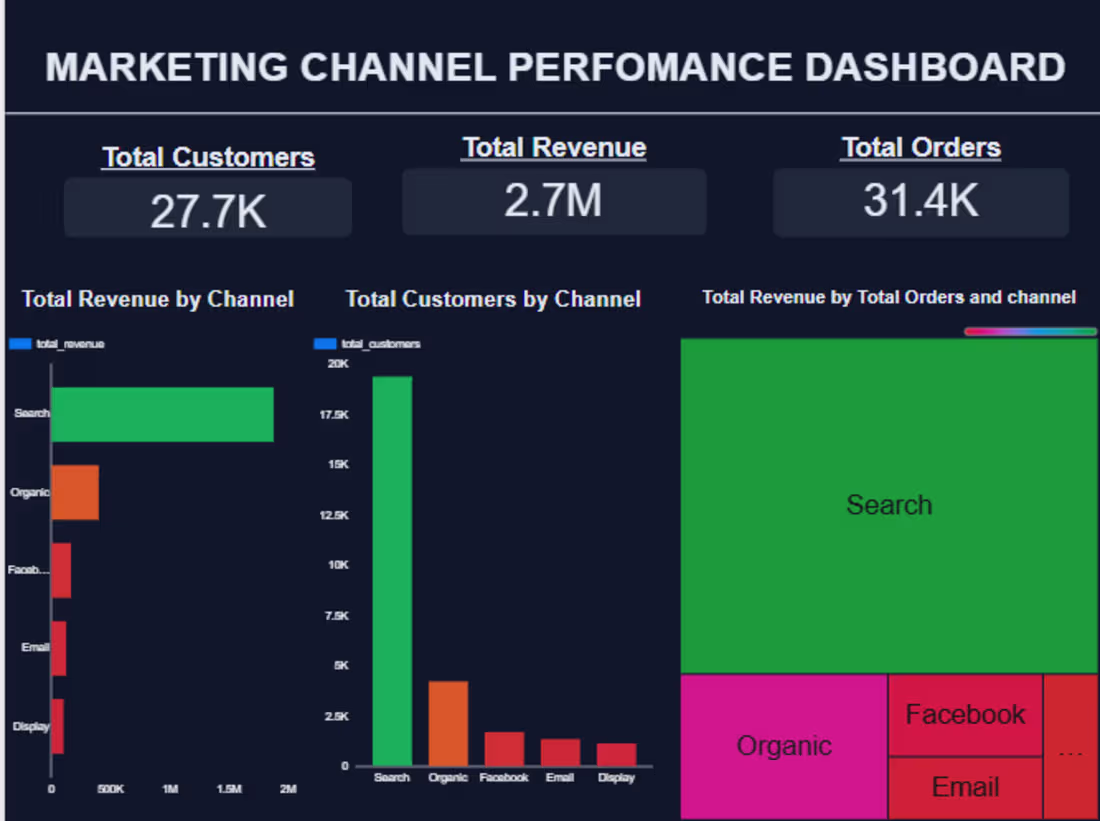
End-to-end analytics engineering pipeline built on BigQuery, dbt, and Looker Studio. Ingested raw marketing data across 5 channels, modelled staging and mart layers in dbt (stg_customers, stg_orders → mart_channel_performance), and deployed a live executive dashboard tracking 2.7M revenue, 27.7K customers, and 31.4K orders. Search identified as the dominant revenue and customer acquisition channel. Full pipeline version-controlled on GitHub with documented data models and KPI definitions.
Stack: BigQuery → dbt → Looker Studio → GitHub
0
30