
Prabhat Ranjan
Data Analyst /Power Bi Developer
New to Contra
Prabhat is ready for their next project!

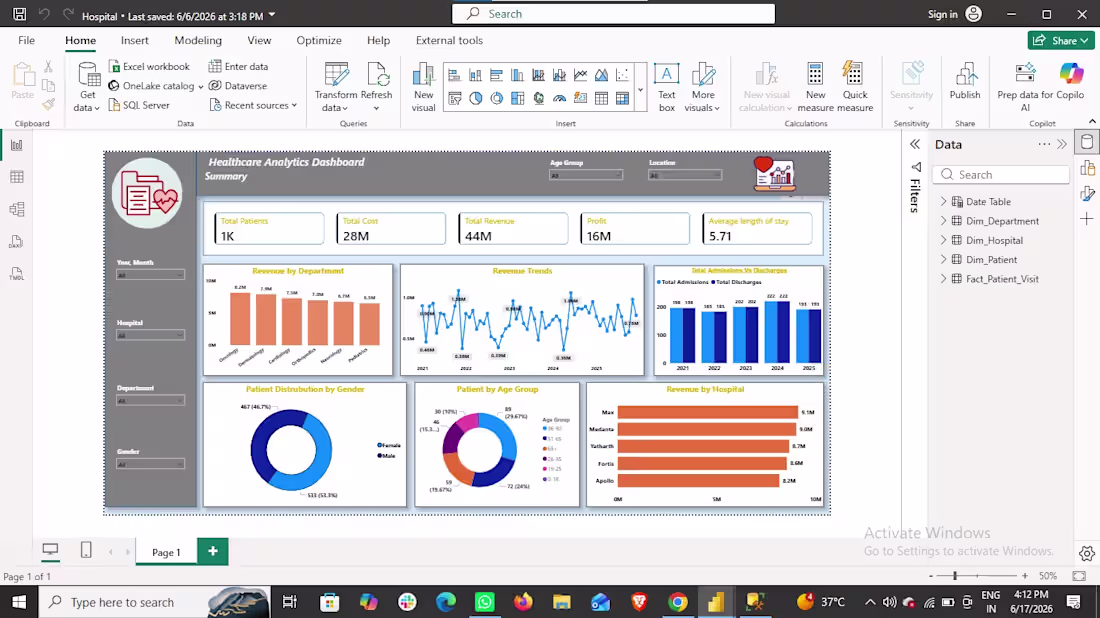
Healthcare & Clinical Operations Analytics Dashboard
Business Problem: Hospital executives needed to monitor financial health (revenue vs. margins), admission velocities, and demographic distributions to manage clinical capacity.
Tools Used: Power BI, Data Modeling, Relational Star Schema (Fact_Patient_Visit, Dim_Patient, Dim_Hospital)
KPIs Tracked: Total Patients (1K), Total Cost ($28M), Total Revenue ($44M), Net Profit ($16M), Average Length of Stay (5.71 days).
Insights Discovered:
Department Profitability: The Diagnostics and Cardiology departments function as the primary revenue engines for the medical system.
Age & Gender Dynamics: Female patients account for the majority slice of admissions (53.3%), with the 18–30 age bracket representing the highest volume segment (29.67%).
Facility Ranking: Max Hospital leads the healthcare network's financial footprint, generating $9.1M in revenue.
1
90
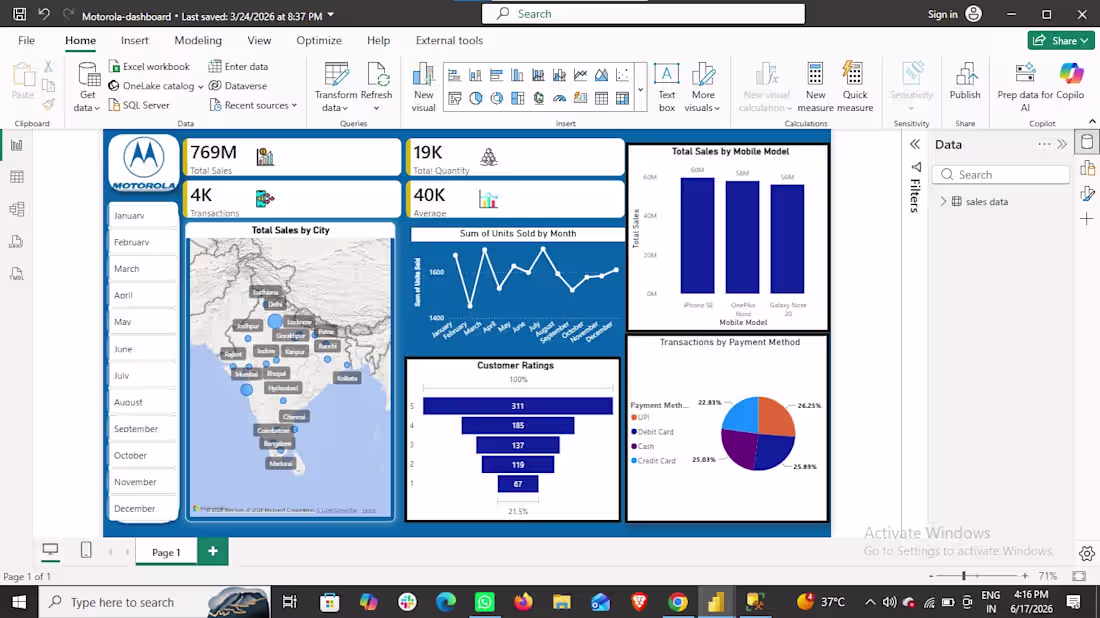
Telecom Sales & Operations Performance Dashboard (Motorola)
Business Problem: Leadership required an interactive view into device sales, transaction volumes, geographic distribution, and payment metrics to optimize local market inventory.
Tools Used: Power BI, Power Query, DAX, Geographic Mapping
KPIs Tracked: Total Sales ($769M), Total Quantity (19K), Total Transactions (4K), Average Sales Value (40K).
Insights Discovered:
Geographic Concentrators: North and Central India (hubs like Delhi and Lucknow) represent the highest density of retail transaction volume.
Product Drivers: The iPhone SE, OnePlus Nord, and Galaxy Note 30 drive the bulk of high-value mobile revenue.
Financial Channels: Payment ecosystems are highly diversified, with Credit Cards (26.25%) and Debit Cards (25.03%) dominating customer checkouts over cash.
0
22
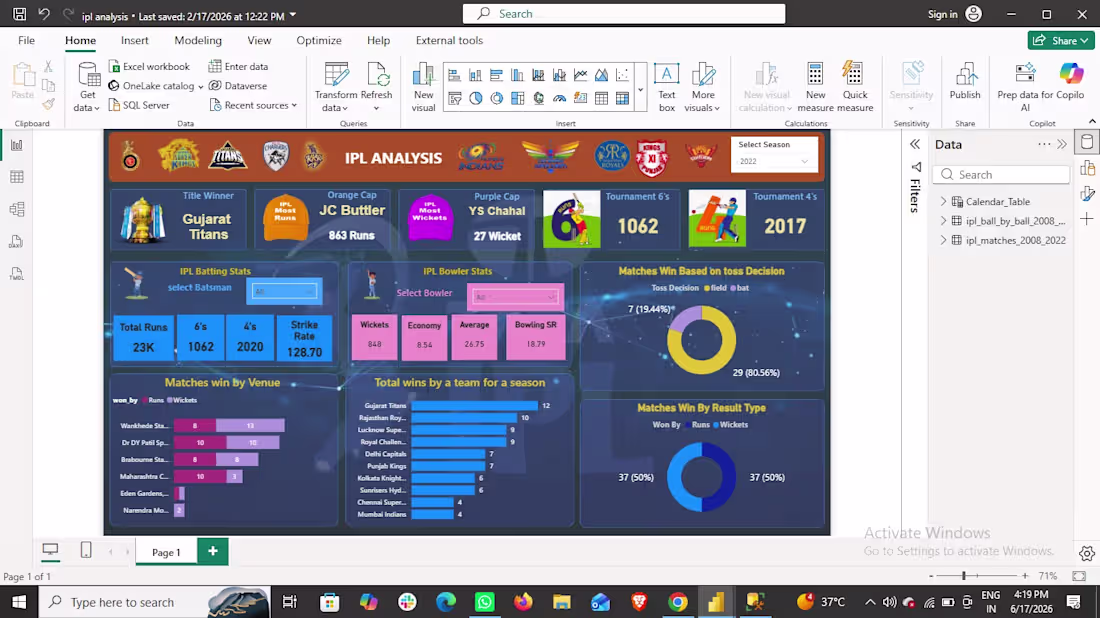
Indian Premier League (IPL) Historical Analytics Engine
Business Problem: Sports franchise management needed a comprehensive diagnostic analytics platform to evaluate match variables, player statistics, and historical trends for tournament strategy.
Tools Used: SQL, Power BI, Advanced DAX, Theme Customization
KPIs Tracked: Total Runs (23K), Historical 6s (1062), Historical 4s (2020), Overall Strike Rate (128.70), Total Wickets (848).
Insights Discovered:
Toss Leverage: Deciding to field first after winning the toss yields an overwhelmingly higher win percentage (80.56% / 29 match wins) compared to batting first.
Match Outcomes: Over a multi-season timeline, match results are perfectly split 50/50 between teams winning by runs versus winning by wickets.
Franchise Domination: The Gujarat Titans led historical season records with 12 total wins, closely followed by Rajasthan Royals.
0
27
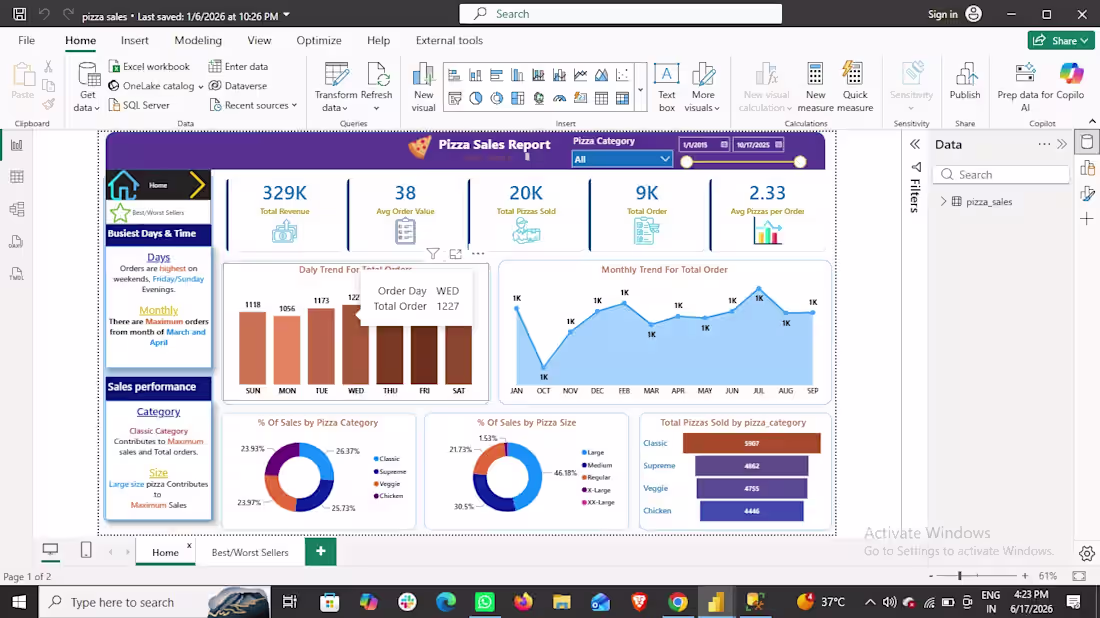
Pizza Quick-Service Restaurant (QSR) Sales & Trend Analyzer
Business Problem: A global pizza chain lacked deep operational visibility into peak consumer ordering hours, order sizing configurations, and product menu performance.
Tools Used: Power BI, Power Query ETL, Time Intelligence DAX, Python (for initial dataset profile)
KPIs Tracked: Total Revenue ($329K), Average Order Value ($38), Total Pizzas Sold (20K), Total Orders (9K), Average Pizzas Per Order (2.33).
Insights Discovered:
Peak Demand Windows: Orders spike drastically during weekend blocks (Friday and Saturday evenings), with Wednesday peaking as the highest volume weekday (1,227 total orders).
Sizing Preference: Large-sized pizzas dominate consumer demand, contributing to 45.89% of the overall sizing mix.
Category Leadership: The Classic Pizza category serves as the highest volume contributor, moving 5,907 total units.
Business Problem: Restaurant inventory managers struggled with ingredient waste due to poor tracking of bottom-tier menu performers and top revenue drivers.
Tools Used: Power BI, TopN Filtering, Conditional Formatting
Metrics Tracked: Revenue by Product, Quantity Sold by Pizza Type, Total Orders by Menu Item.
Insights Discovered:
Revenue Champion: The Thai Chicken Pizza acts as the critical revenue anchor, generating maximum individual financial returns ($43K).
Volume Leader: The Classic Deluxe Pizza processes the highest standalone transaction quantity.
Dead Stock Warning: The Brie Carre Pizza ranks at the absolute bottom of both revenue and quantity matrixes, making it an immediate candidate for menu removal to save inventory costs.
0
27