Best New Relic Alternatives Updated
If you are someone who has explored monitoring and observability solutions for your program, New Relic One is hard to miss. It is a comprehensive monitoring and management application initially started out by Lew Cirne in 2008.
Then on, it expanded its product base to include over twenty products ranging from front-end to back-end, infrastructure, logs, and even vulnerability addressing. Today, it stands as one of the most successful analytics platforms for enterprises dealing with data.
All that being said, there are some strong reasons why developers and businesses are now looking out for alternatives. The biggest of them being the COST. New Relic is priced on the higher end of the spectrum often suiting to needs of only large corporations with deep pockets.
This, along with a few other considerations has made businesses migrate to more newer, affordable, quality products in the same niche. And this blog is intended to guide you with the right choices for that.
We will be looking at the best alternatives to New Relic in this article, highlighting their pros and cons along with their pricing. Without further Ado, Let’s get started!
Table Of Contents:
What makes New Relic so Popular?
New Relic is expansive and that has a lot to do with its popularity. When I say expansive, just look at their product numbers. Not a lot of the other Monitoring programs offer such a wide variety of products.
They offer services that can be grouped prominently under five headings - Infrastructure Monitoring, Application Monitoring, Browser Monitoring, Log Management, and Application Security.
Their new AI assistive tool “Grok” uses a chat interface to answer queries related to errors and does a root cause analysis for them.
All that being said, there must still be something that is making businesses exercise caution before making a New Relic purchase. Head down to all the points that I have listed below!
Pain points with New Relic
New Relic's pricing structure can be quite costly. While their data ingestion prices are reasonable, the real expense lies in the charges for users.
To provide some context, every account, regardless of whether it's on the Standard, Pro, or Enterprise plan, receives 100GB of free data ingestion per month. After surpassing this limit, they charge $0.30 per GB, which is a fair price for basic data ingestion.
However, in addition to the $0.30 per GB cost after the initial 100GB, users are also required to pay individually. The amount varies depending on the level of observability desired for each user. Although they offer a free basic option, its capabilities are quite limited.
Beyond the limited free access, the price per Core user starts at $49 per month on the standard plan. It's important to note that this doesn't grant the user full platform access. For complete platform access with the standard plan, the price increases to $99 per user per month, with a maximum limit of 5 users. Fortunately, they do provide 1 free account with full-platform access.
Moving on to the Pro plan, they still offer the free limited account, and the cost per Core user remains at $49 per seat. However, if you require full platform access, the price jumps to a staggering $418.80 per user per month! The Pro plan also introduces the option of "Data Plus Ingestion," where instead of paying $0.30 per GB beyond the 100GB allowance, the rate becomes $0.50 per GB.
As for the Enterprise plan, the prices remain the same until you require full access. At this level, you'll need to allocate a substantial $658.80 per user per month.
Things to Keep in Mind When Choosing an Alternative
When choosing a Monitoring Tool, everything boils down to its EFFICIENCY. If your tool is able to detect errors faster than your competitor’s, you win! So, more emphasis goes into the quality of the product than its brand.
Choosing a brilliant product, very much under your budget limit is not an easy task. This entire article is purposed to bring to you the best of those tools available in the market at present. We have laid careful emphasis on the product features so that you can make an informed choice.
Even if you are trying out a different tool apart from all those listed here, make sure to keep in mind these pointers for a quality check:
Feature Set - Assess the feature set of the alternative tool to ensure it meets your requirements. Look for capabilities such as real-time monitoring, alerting, error tracking, and distributed tracing.
Scalability - Evaluate the scalability of the alternative tool to ensure it can handle the growth of your applications. Consider the tool's ability to monitor and manage performance across various environments and scaling dimensions.
Ease of Use - User-friendly interfaces and intuitive workflows are crucial for efficient utilization. Consider how easy it is to set up, configure, and navigate the alternative tool, as this can impact the onboarding process and day-to-day operations.
Compatibility - Ensure compatibility with your technology stack. The alternative tool should support the programming languages, frameworks, and infrastructure components that your applications rely on.
Cost Structure - Understand the pricing model of the alternative tool. Consider not just the upfront costs but also any potential hidden fees, licensing structures, and scalability costs. Ensure that the pricing aligns with your budget and growth plans.
Customization and Flexibility - Evaluate the level of customization the alternative tool offers. Some applications may require specific configurations or integrations, and having a flexible tool can be crucial for adapting to your unique use cases.
Community and Support - Check the level of community support and the availability of resources such as documentation, forums, and tutorials. Additionally, assess the responsiveness and quality of the vendor's support services.
Integration Capabilities - Consider how well the alternative tool integrates with your existing tools and workflows. Seamless integration with other tools in your DevOps toolchain can enhance overall efficiency.
Performance Impact - Assess the impact of the monitoring tool on the performance of your applications. Some tools may introduce overhead, affecting the performance they aim to monitor.
Some of the Best Alternatives to New Relic:
1. Atatus
Atatus is a full-stack observability platform that provides actionable, real-time insights into your web and backend applications.
It is an all-in-one integrated observability platform that makes application monitoring super easy with transaction monitoring, database monitoring, external requests monitoring, live performance data, smart notifications, compare releases, full-text search, and error tracking.
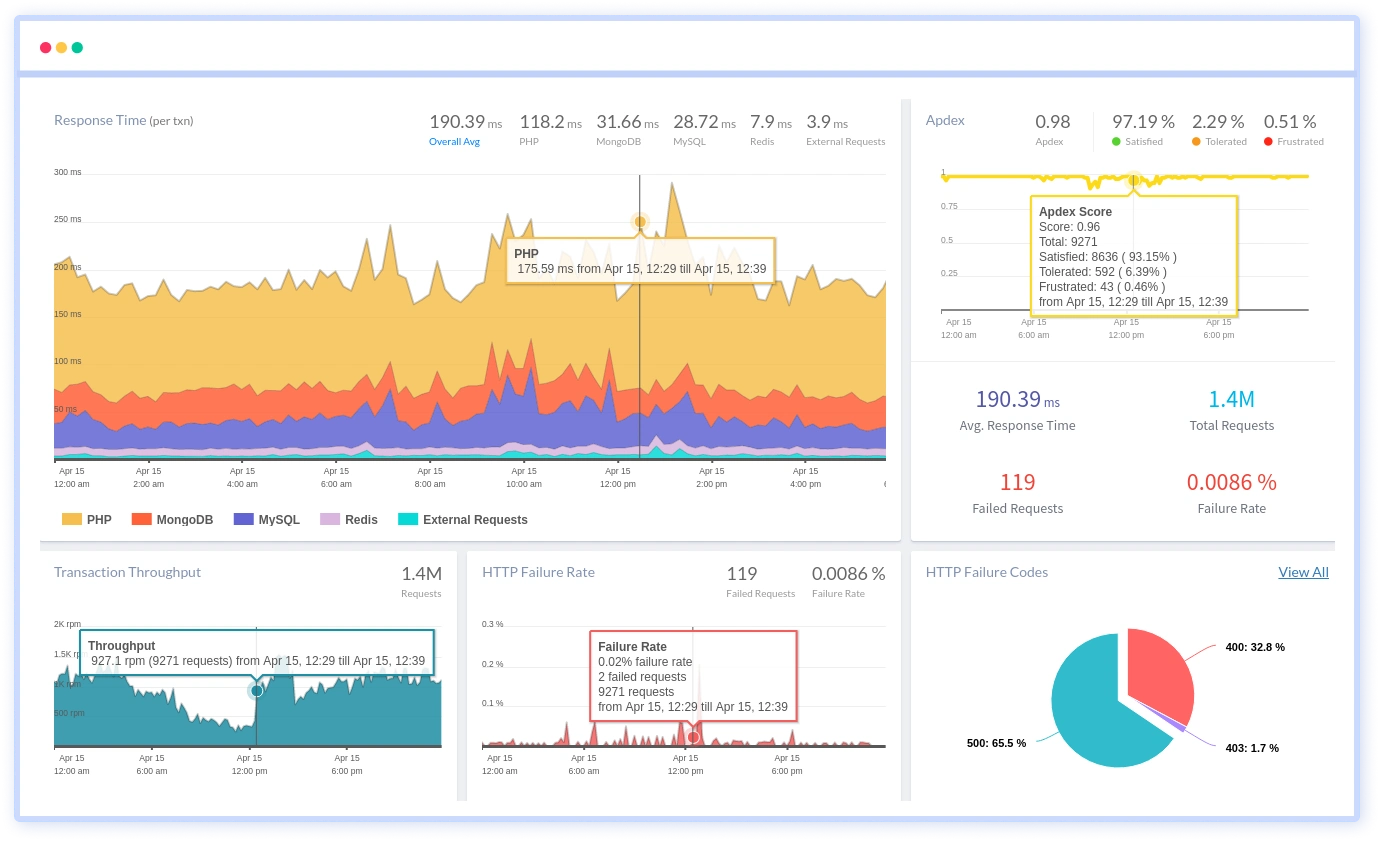
Atatus Dashboard
Feature Highlights:
Pros
User-friendly interface for easy navigation
Easy to set up and start (they give a 14-day free trial with no credit card requirements!)
Customizable alters and notifications
Designed to scale with the growth of the application
Well-suited for monitoring both enterprises and small businesses.
Supports third-party integrations efficiently
Optimal pricing and an easier learning curve
Regular updates about new features
Compared to New Relic, Atatus allows you to see the percentile for your XHR performance, the individual AJAX call and REST API issues causing the application to slow down, and also see each AJAX event individually using their AJAX monitoring.
The advanced error tracking feature of Atatus captures all back-end errors that occur in your application, by pointing to the exact location of the code, causing the exception.
Pricing
Atatus offers by far the most transparent pricing details, with pricing for each of their solutions listed out on their page. Their APM starts at $0.07 per host per month, RUM at $1.96 per 10000 views per month, and infrastructure monitoring at $0.021 per host hour per month.
Logs Monitoring starts at $2 per GB per month, Synthetics at $1.5 per 10000 check runs per month, and Analytics at $1 per 10,000 events per month.
2. Sematext
Sematext's products are designed to assist with performance monitoring, log management, and real-time analytics, catering to the needs of both DevOps and IT operations teams.
It's solutions are designed to be flexible and scalable, supporting diverse environments such as on-premises, cloud, and hybrid setups.
Feature Highlights:
Full stack observability
Infrastructure Monitoring
Log Monitoring
Real User Monitoring
Synthetic Monitoring
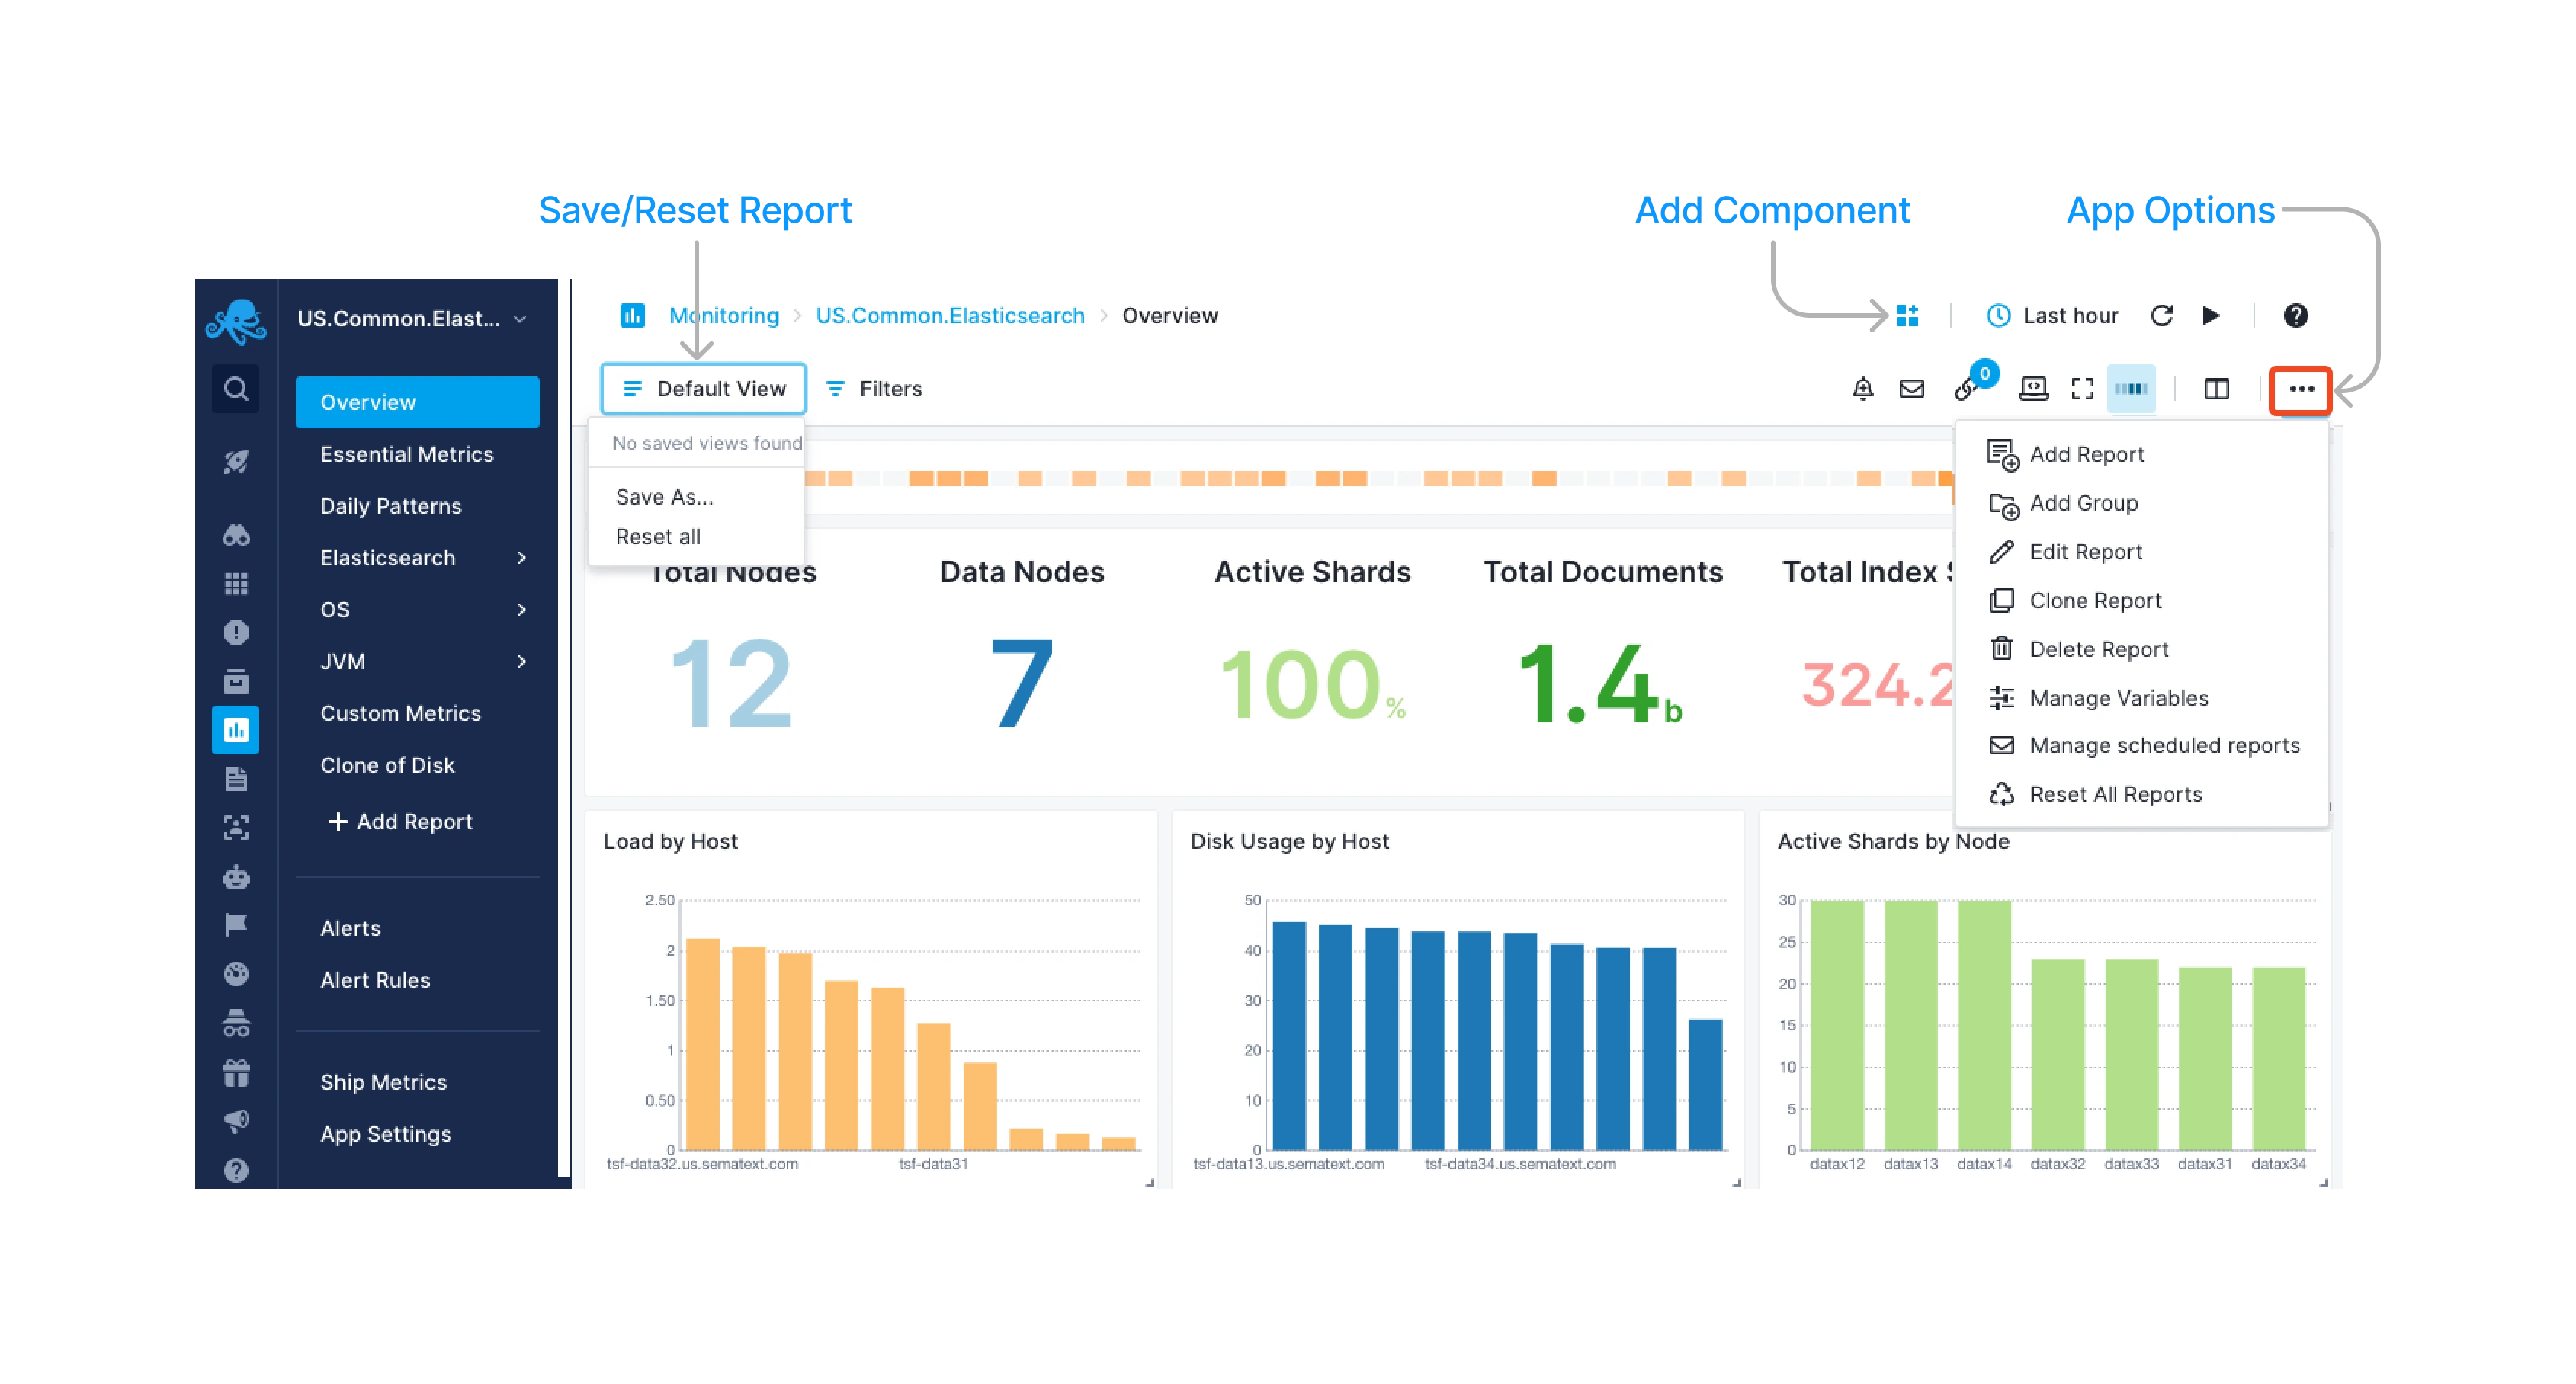
Sematext Monitoring Dashboard
Pros
Customizable alerts and notifications
Anomaly detection and browser checks
On the lesser-priced side
Cons
Fewer integrations available
Depth of specific features unsure
No transaction monitoring
No security monitoring
Pricing
Sematext Logs pricing starts at $50 per month, but since it is based on log data, there is a certain level of control in your hand.
Infrastructure monitoring is offered at $3.6 per host, RUM at $9 per month for 25000 page views, Uptime metrics rely on pay-as-you-go with HTTP monitor costing $2 for 200000 runs while Browser checks come at $7 for 15000 runs
3. Sentry
It is designed to capture and report errors, exceptions, and crashes in real-time, providing valuable insights into the health and performance of software applications.
Sentry supports multiple programming languages and frameworks, making it a versatile solution for developers working on various types of projects.
It is known for its ease of integration, comprehensive error reporting, and the ability to provide actionable insights for developers.
While Sentry's core functionality is open source, there is also a cloud-hosted version called Sentry.io that provides additional features and services for users who prefer a fully managed solution.
Feature Highlights:
Error tracking
Event and transaction tracking
Release Monitoring
Performance monitoring
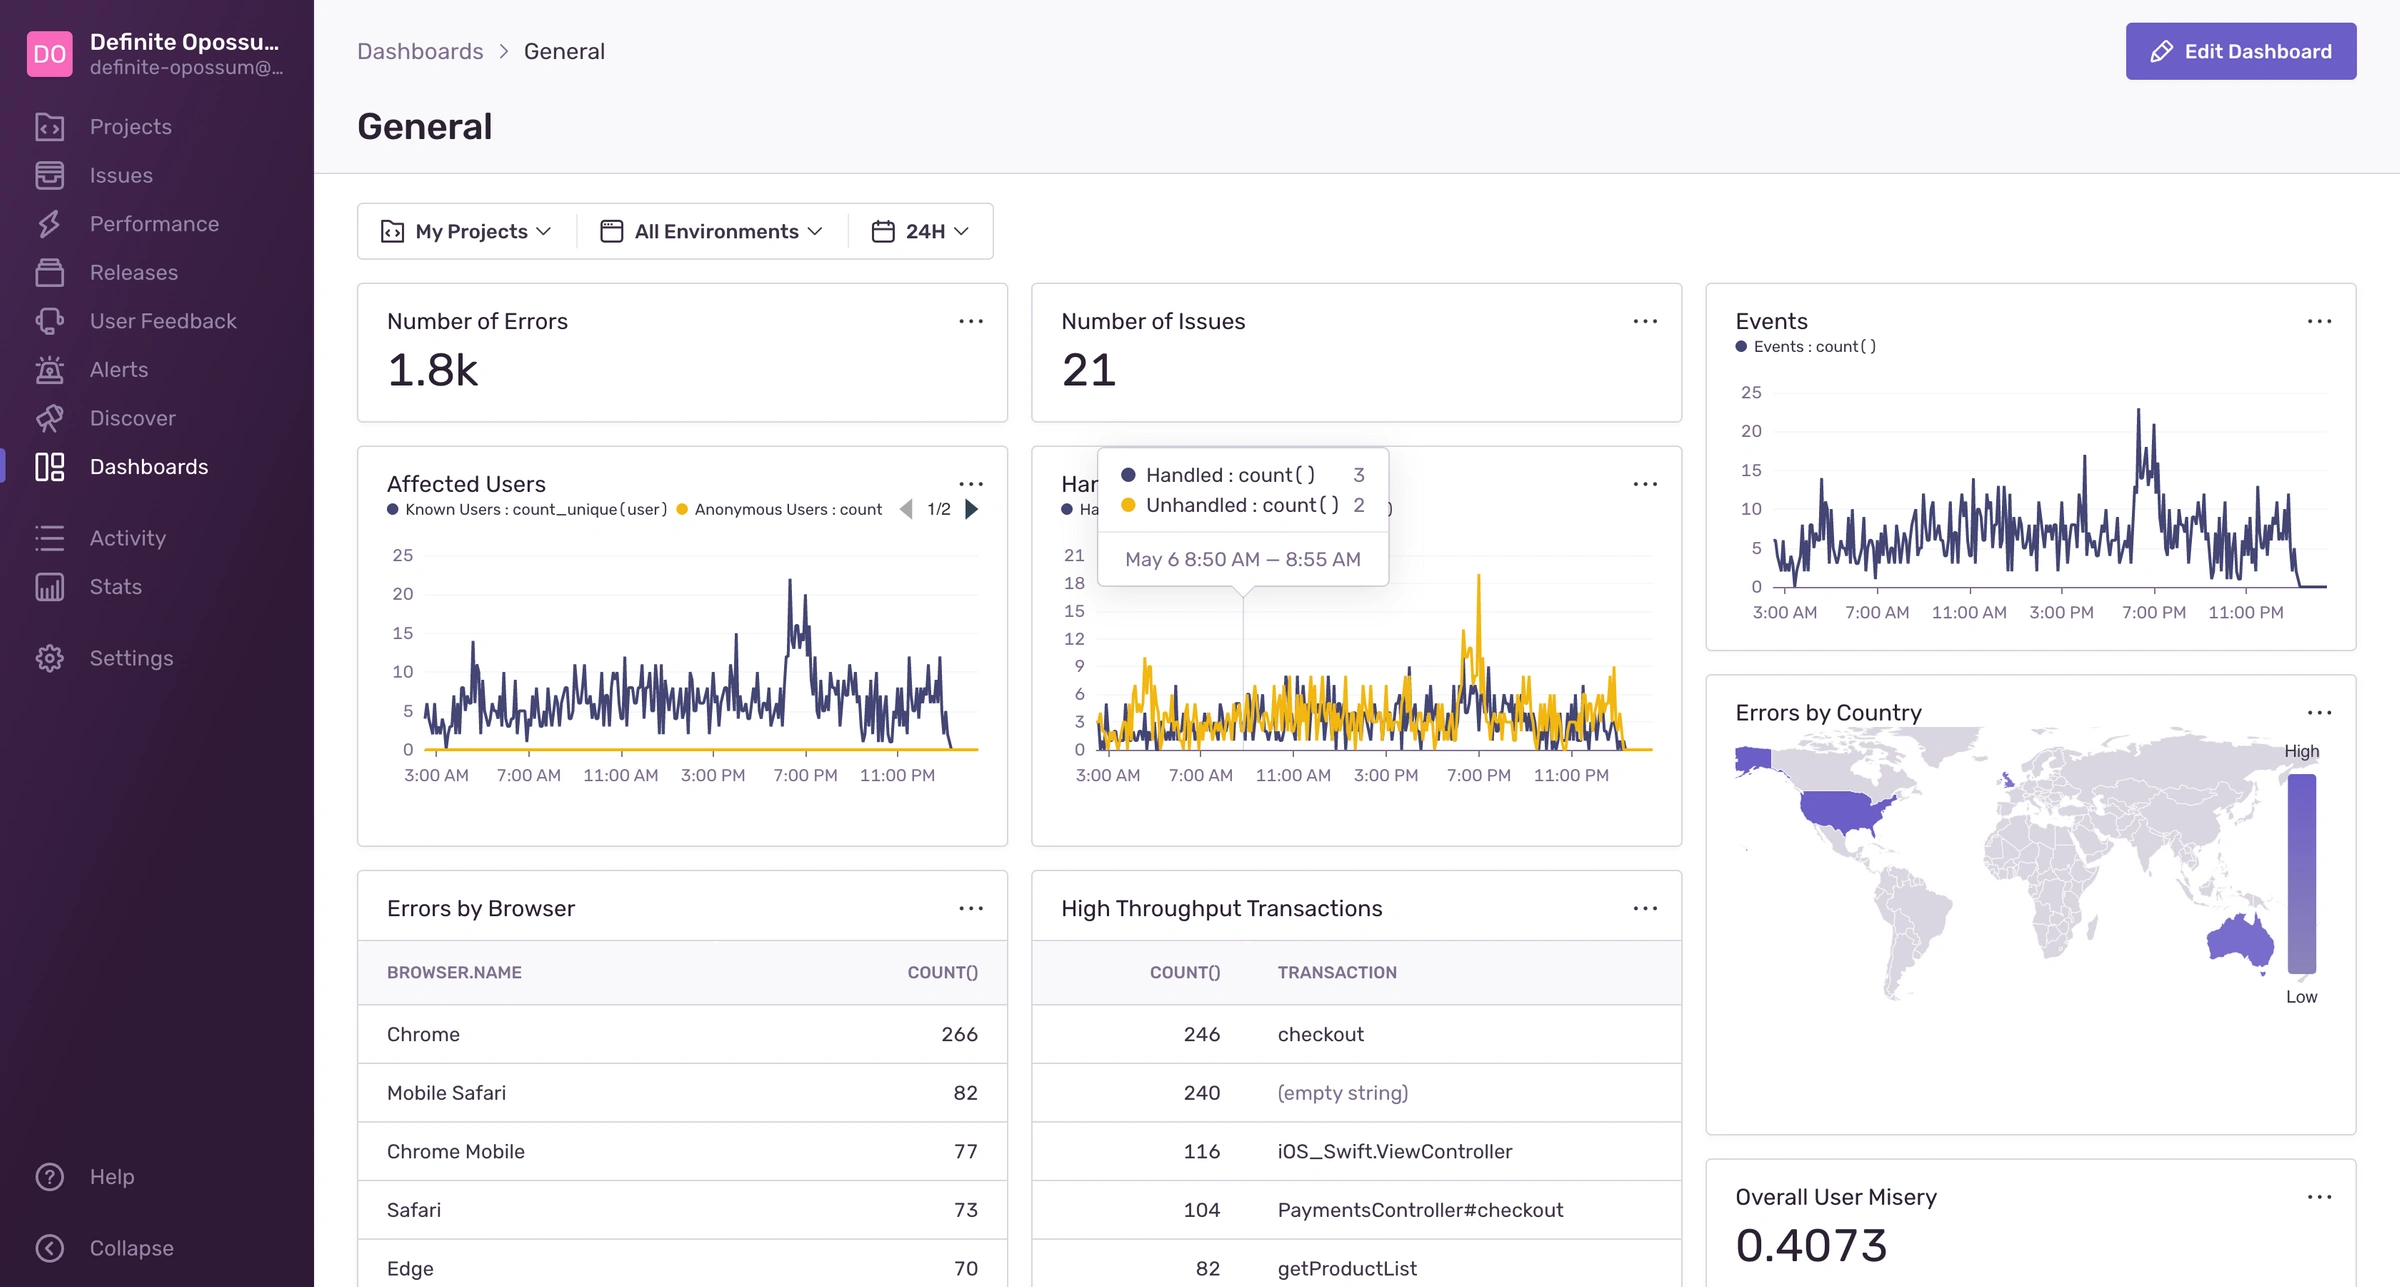
Sentry Monitoring Dashboard
Pros
Directly gathers user feedback within Sentry
Security features for safety
Sentry is open-source
On-premise deployment available
Cons
The functionality of products is relatively lesser than those listed in this blog
Filtering errors are said to be difficult
Delays reported in error reporting
Pricing
Sentry’s free version covers error tracking and performance monitoring upto a certain level. Their team plan starts at $26 when billed annually, business plan at $80 per month billed annually which includes monitoring insights powered by Discover. They have left their enterprise plan open for quotation.
4. AppDynamics
AppDynamics is an application intelligence tool, which offers real-time insights into an application, user, and business performance. It is an integrated suite built on an innovative, enterprise-grade App iQ platform, which enables the user to make faster decisions that enhance operational improvement, business performance, and customer engagement.
The operational agents give an overview and understanding of every process and transaction by constructing a complete view of it. Then, sends the information to a centralized controller to get a baseline of each service. If the service gets below or beyond that baseline, you will get an alert to adjust or fix it accordingly.
Feature Highlights:
Application performance monitoring
End user monitoring
Infrastructure Visibility
Business transaction monitoring
Log Analytics
Database monitoring
AppDynamics Monitoring
Pros
Deep-level code diagnostics
Integerable with many third-party tools
Machine learning and AI for data analysis
Simple deployment feature
Cons
Third-party tools tend to start or stop instances being monitored
Platform’s interface is not very appealing to customers
Pricing
Basic infra monitoring starts at $6 per month per core, synthetic monitoring comes at $60 per month per core, while its enterprise edition reaches upto $90 per month.
They haven’t explicitly mentioned cost per user or according to data usage. Also, their RUM is charged at $0.06 per month for 1000 tokens. (We don’t know what those tokens exactly mean)
5. Splunk
The most remarkable aspect of Splunk is its original and practical AI-driven analytics, which shorten inquiry times by instantly alerting you to important patterns. Three different search options are offered by Splunk: fast, smart, and verbose.
They give you the best tracing experience possible, with each mode's capabilities tailored based on how meticulous you need to be.
Feature Highlights:
Log management
Search and Analytics
Machine data analysis
SIEM (security information and event management)
IT Operations Monitoring
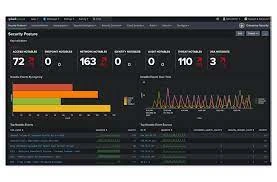
Splunk Security Monitoring
Pros
Machine learning and AI-powered Analytics
Scalable horizontally
On-premises or cloud deployment
Works with unstructured data from various sources
Cons
Keep updated with Splunk Processing language
Outdated UI design
Lesser products and functionality
Pricing
Synthetic monitoring starts at $1 for upto 10,000 uptime requests. RUM at $14 for 10000 sessions, Incident responses at $5 per user per month, infrastructure cloud monitoring at $15 per month per host, and APM at $55 per month per host.
The downside to all this is that you can avail of all these only if you opt for an annual plan, they dont give monthly or quarterly breakups.
6. SigNoz
SigNoz is a free and open-source APM. It aids in application monitoring & problem-solving for developers. SigNoz provides a uniform UI for metrics and traces so that there is no need to jump between multiple tools such as Jaeger and Prometheus.
Feature Highlights:
Distributed Tracing
Performance monitoring
Pros
Signoz is open-source, so that is the biggest bonus.
Supports multiple programming languages
Works well in a Cloud-Native environment
Scalable storage using elasticserach
Visualization of dependencies between services
Cons
Relatively new in the market, so might not have offered community support
Limited functionality warning
Pricing
They have separated two plans - teams at $199 per month which covers logs (per GB for 15 days), traces (per GB for 15 days), and metrics (for a million samples in a month). Their enterprise version has custom pricing options and is charged based on the scalability of your application.
7. AppOptics
AppOptics is a product offered by SolarWinds, AppOptics supports alerting based on predefined thresholds, enabling users to receive notifications when performance metrics deviate from the expected norms.
AppOptics can integrate with various DevOps tools and platforms, facilitating a seamless workflow for development and operations teams. AppOptics is designed to work in cloud, on-premises, and hybrid environments, supporting popular cloud platforms like AWS, Azure, and others.
Feature Highlights:
Application Performance Monitoring
Distributed Tracing
Infrastructure Monitoring
Database Monitoring
Pros
Easy user interface
Appoptics is backed by Solarwinds, so there is good community support
Integration with other SolarWinds products
Custom code instrumentation available
Cons
Expensive per host
Comparatively limited functionality than all other products on this list
Not-so-promising user experience
Pricing
Their APM starts at $9.99 per host per month but comes as a package of 10 hosts. So, totaling it up would end up around $99.99 per month per host for only 10 hosts and 100 containers, which is not a great deal.
8. Dynatrace
Dynatrace is one of the well-known New Relic competitors, offering both application performance management and infrastructure monitoring. It provides application intelligence to simplify cloud management and accelerate digital transformation.
Davis, Dynatrace AI assistant processes dependencies to facilitate metrics and answers automatically. They provide OneAgent, which discovers all the processes running on a host and activates instrumentation for your stack.
Their machine learning technology automatically learns what normal performance looks like, and dynamically adapts to the environmental changes.
Also, their automation capabilities are impressive and benefit from providing more detailed insight into metrics. The APM tool includes infrastructure monitoring and AIOps, which makes it a versatile New Relic Competitor.
Feature Highlights:
Full-stack monitoring
Real user monitoring
Cloud and microservices monitoring
Infrastructure monitoring
User session replay
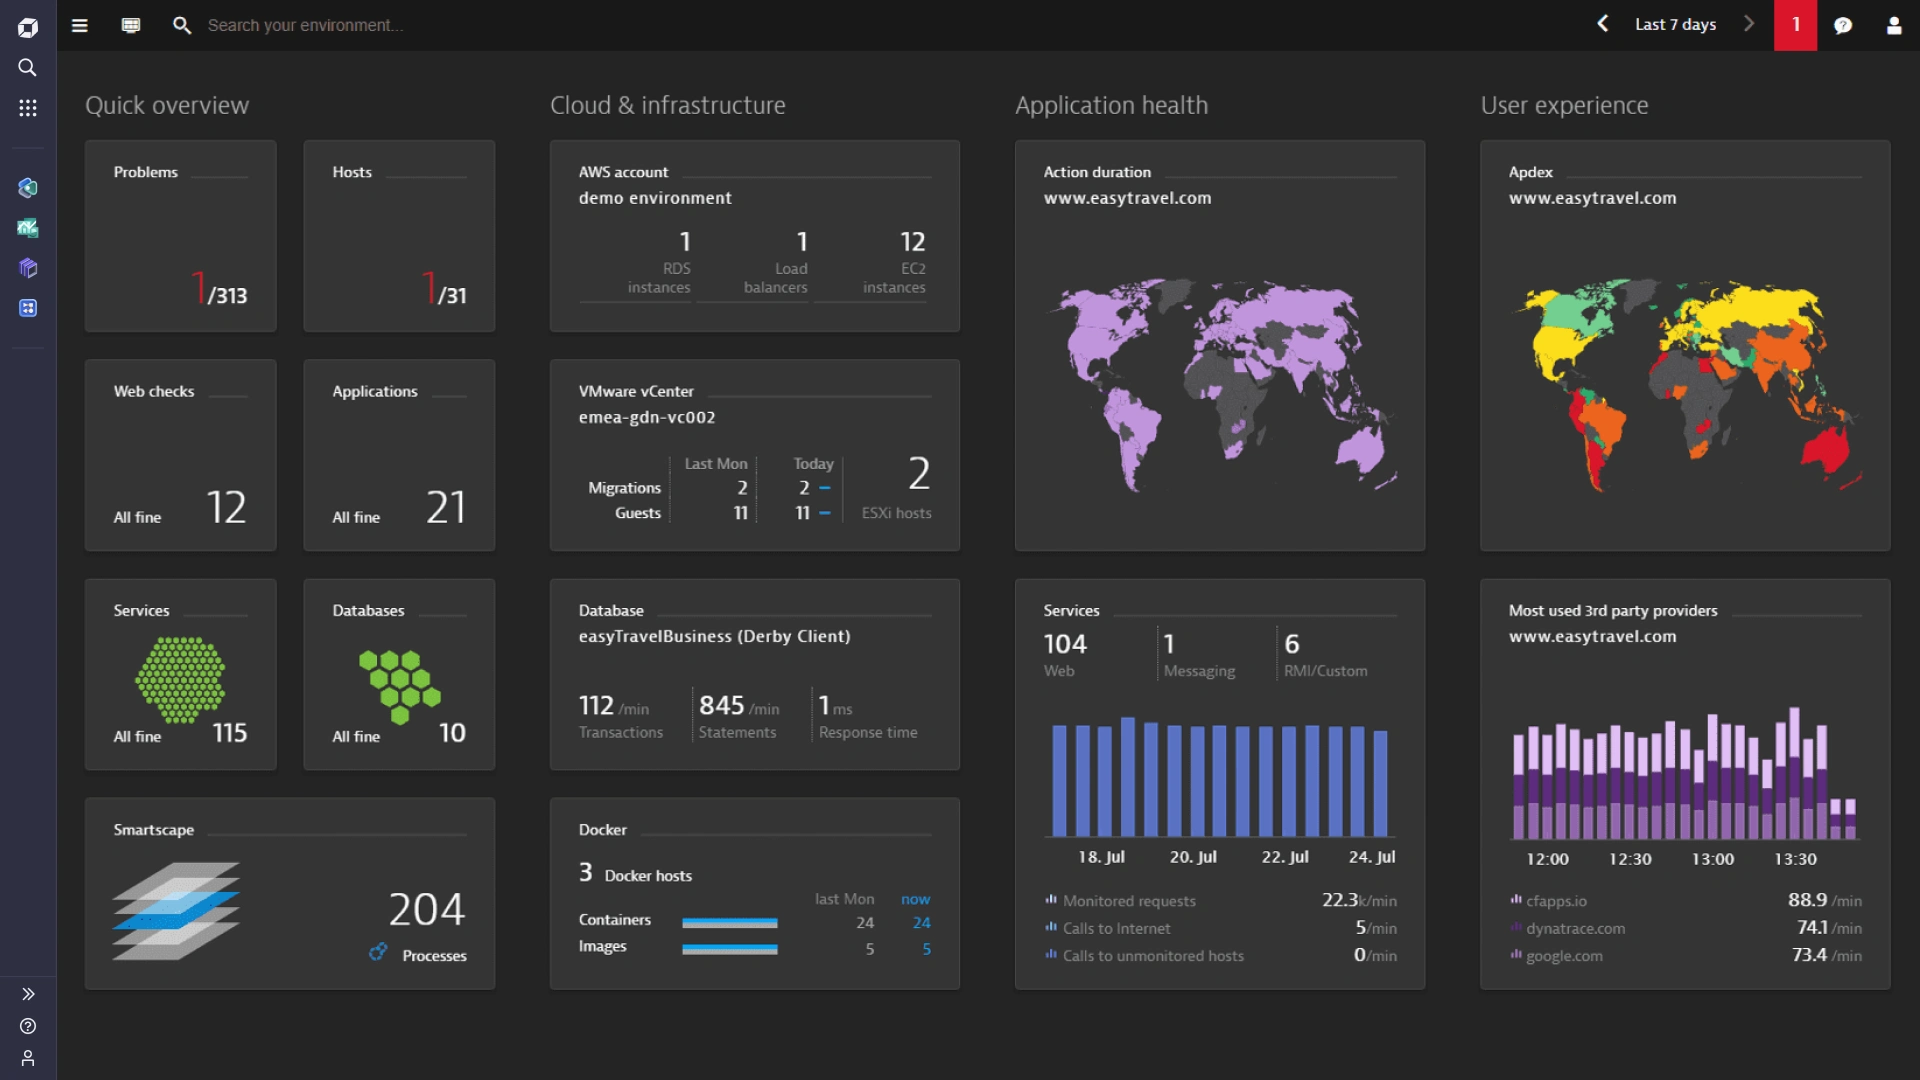
Dynatrace Dashboard
Pros
Automated discovery and baseline establishment of all application components
AI-powered root cause analysis
Smartscape technology for visualizations
Cloud-native and multi-cloud support
Cons
Complexity reported in the user interface
Documentation is not upto standard
Definitely one of the pricey solutions in this list
Pricing
They charge based on requests per hour and not per GB. For example, their synthetic monitoring starts at $0.001 for 1 request. Such a nice way to put it!
Because for a single HTTP monitor requesting uptime checks at the interval of 1 minute, it would add up to $0.001 *1440*30 = $43.2 per month.
Similarly, if we calculate for infrastructure monitoring, the price comes up to $28 per host per month, RUM at $225 per month for 100.000 sessions.
9. Datadog
Datadog is very similar to New Relic, so much so that there is a comparison article on their official page itself. They are both big names in Monitoring and offer mostly similar products.
Datadog currently offers 21 products including cloud infrastructure, APM, container monitoring, serverless monitoring, and logs among others. Datadog's APM users praise the platform for its ability to collect and ingest a wide range of data sources and generate intuitive dashboards.
It has a SaaS dashboard that encompasses a log file viewer, monitoring tools, live log & archive storage, and an archive access utility.
It is a user-friendly tool that enables users to correlate individual logs and discover patterns. It can aggregate metrics and events from over 500 integrated technologies, tag and store them, and collect, search, and analyze logs to correlate them using specific traces, metric spikes, or security signals.
Feature Highlights:
Application Performance Monitoring
Infrastructure Monitoring
Log Management
Synthetic Monitoring
Real User Monitoring
Network Performance Monitoring
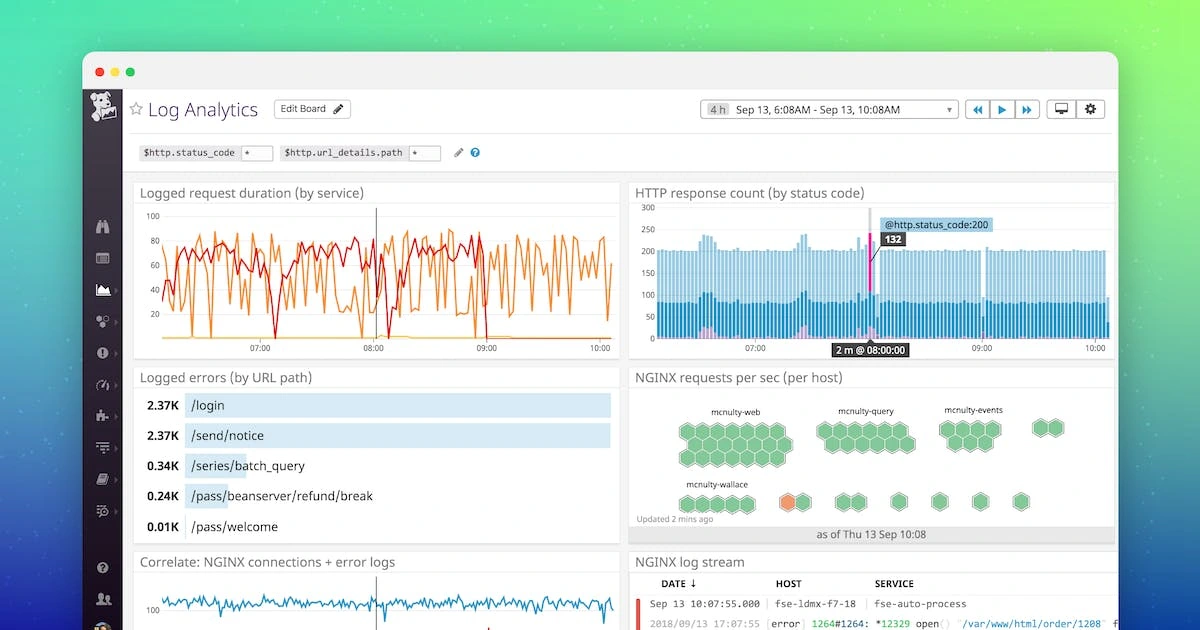
Datadog Logs Monitoring
Pros
Customizable dashboards and collaboration features
Configurable alerting system
Extensive library of integrations
Integration of machine learning and anomaly detection
Continuous profiler to analyze code-level errors
Cons
Very expensive
A high Learning curve involved
Unsatisfactory customer service
Interface may not be upto everyone’s liking
Pricing
As mentioned earlier, they have a host of programs in their kitty, each priced at a different range. Some of the popular products range from - Basic Infrastructure monitoring comes at $18 per month per host, API Tests $7.20 for every 10,000 test runs, and browser tests comes at $18 for 1000 tests.
Since they offer so many products, it is easier to get lost and end up paying up a lot more than what you actually require. It is necessary to exert caution about the number of products you are choosing and see how it works in the long run.
Conclusion
Each alternative brings its unique strengths, offering features such as comprehensive observability, advanced analytics, and flexible pricing structures.
Whether prioritizing cost-effectiveness, scalability, or specific functionalities, businesses can find suitable alternatives to meet their performance monitoring and observability requirements.
While New Relic remains a widely adopted and trusted solution, the wealth of alternatives provides organizations with the flexibility to tailor their choice based on specific use cases and preferences, ultimately empowering them to optimize their application performance and ensure seamless user experiences.
Like this project
Posted Feb 17, 2024
Do you know why businesses are migrating from New Relic? Stay ahead of the game by exploring New Relic alternatives and find the tool that has the potential to…
Likes
0
Views
13


