
🚀 Introducing GraphBridge – Turn JSON into Grafana Dashboards
One thing I've noticed while working on different projects is that applications already have valuable metrics, but getting those metrics into Grafana often requires exporters, custom integrations, or additional setup.
I wanted something much simpler.
So I built GraphBridge.
The idea is straightforward:
Your Application
↓
Send JSON
↓
GraphBridge
↓
Prometheus
↓
Grafana
Instead of writing custom exporters, your application simply sends JSON metrics to GraphBridge.
For example:
{
"active_users": 85,
"orders_today": 42,
"revenue_today": 9840,
"failed_jobs": 3,
"latency_ms": 210
}
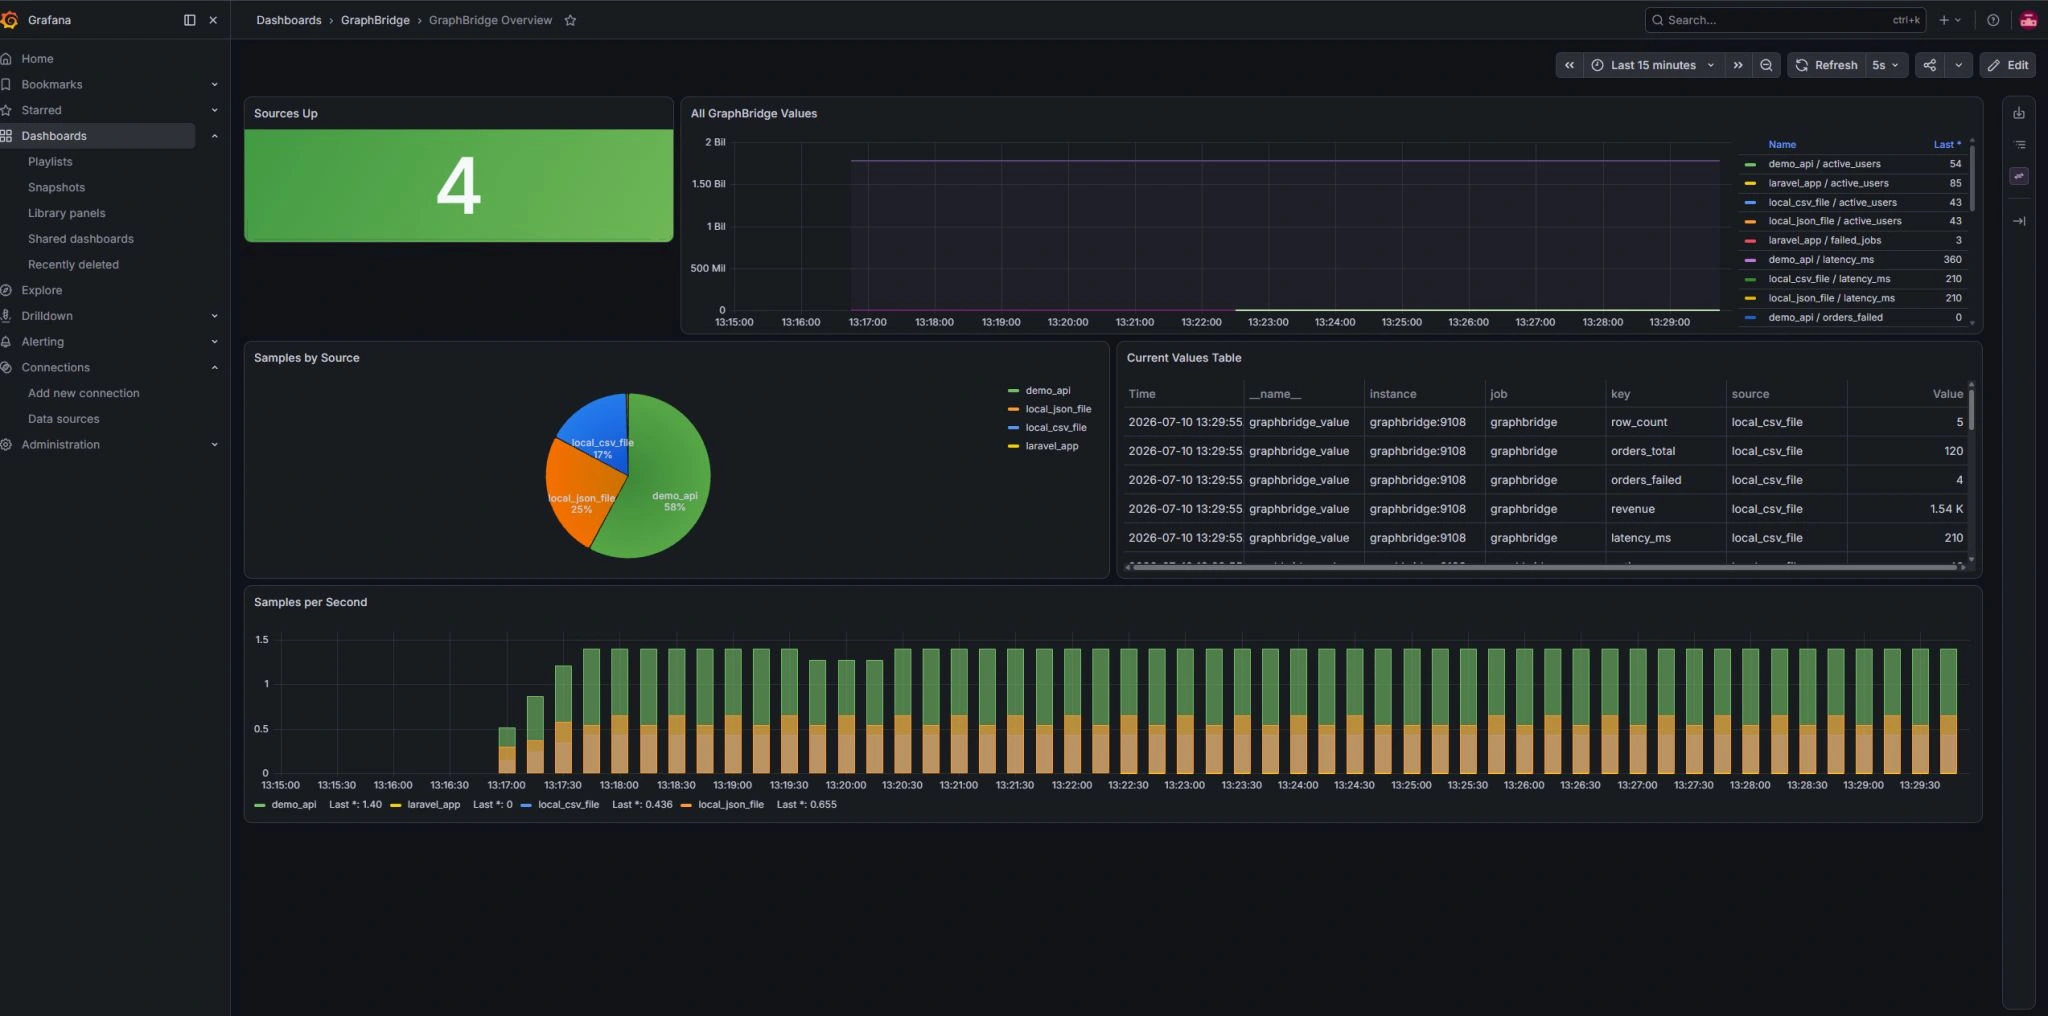
GraphBridge automatically converts the data into Prometheus metrics, making it immediately available for Grafana dashboards.
Current features
✅ JSON Webhook API
✅ REST API polling
✅ JSON & CSV data sources
✅ Prometheus /metrics endpoint
✅ Docker Compose deployment
✅ Auto-configured Grafana dashboard
✅ Example integrations for Laravel, FastAPI, Node.js, and custom applications
Possible use cases
• Application monitoring
• Queue & background job metrics
• Business dashboards
• API performance monitoring
• FFmpeg streaming statistics
• IoT sensor metrics
• Internal analytics
• Custom operational dashboards
The goal is simple:
Send JSON. Visualize everything.
This is the first public MVP, and I'm planning to continue improving it with additional integrations and monitoring templates.
I'd love your feedback and suggestions!
⭐ GitHub:
https://lnkd.in/dAYdNJxg
0 likes · 0 views · Sep 17, 2026
🚀 Introducing GraphBridge – Turn JSON into Grafana Dashboards One thing I've noticed while working on different projects is that applications already have v...


