Oil & Gas Analytics Dashboard Developed
Hari Om
Oil & Gas Analytics Dashboard
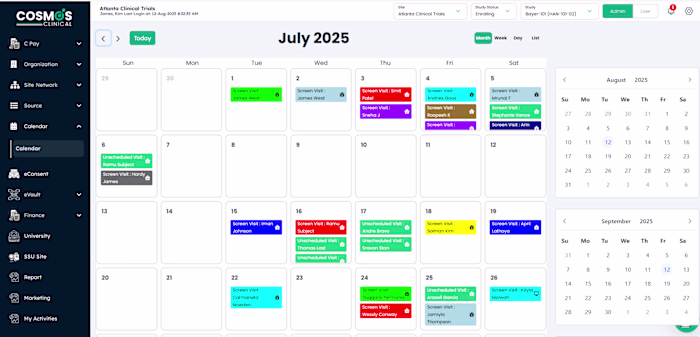
Developed a real-time analytics dashboard for the oil & gas industry to monitor well performance, injection activity, and operational metrics through interactive data visualizations, helping teams make faster and more informed decisions.
Key Features Delivered
Real-Time Operational Monitoring
Built live dashboards to track well performance and field operations.
Displayed real-time injection data and production activity.
Enabled faster response to operational changes and anomalies.
Interactive Data Visualization
Implemented dynamic charts and graphs for clear trend analysis.
Created drill-down reports for deeper operational insights.
Simplified complex field data into easy-to-understand visuals.
Performance & Decision Support
Helped management monitor KPIs across wells and assets.
Improved planning through historical and live data comparison.
Supported data-driven decisions to optimize production efficiency.
Backend & Data Management
Designed secure backend modules for processing operational data.
Built SQL-based reporting and performance queries.
Ensured reliable and scalable handling of large datasets.
Technologies Used
Angular
ASP.NET MVC
Highcharts
SQL Server
Result
Delivered a scalable analytics solution that improved operational visibility, enhanced reporting accuracy, and helped optimize oil & gas field performance through real-time insights.
Like this project
Posted Apr 18, 2026
Oil & Gas Analytics Dashboard Developed a real-time analytics dashboard for the oil & gas industry to monitor well performance, injection activity, and opera...
Likes
0
Views
1