King's Presence

Partner Emmanuel
Case study
King's Presence
An attendance and member-engagement platform for churches, built end to end on AppSheet, from the data model to the branded interface.
Platform: AppSheet + Google Sheets Role: Solo AppSheet developer & workflow designer Developed by Partnerking Automation ● Live, in active use
The problem
Churches, and most member-based organizations, track attendance on paper registers or scattered spreadsheets. There is no visibility into trends, no structured way to welcome and follow up with first-time visitors, and reporting means someone manually compiling numbers after every service.
The system
King's Presence turns that into one app: session-based attendance capture, a visitor follow-up pipeline, live analytics and automated PDF reporting, designed as a proper branded product rather than AppSheet's default styling.
Mobile view
On the phone
The app as staff use it on a service day. Tap any screen to enlarge it. A desktop view of the same app follows below.
Live dashboards & analytics
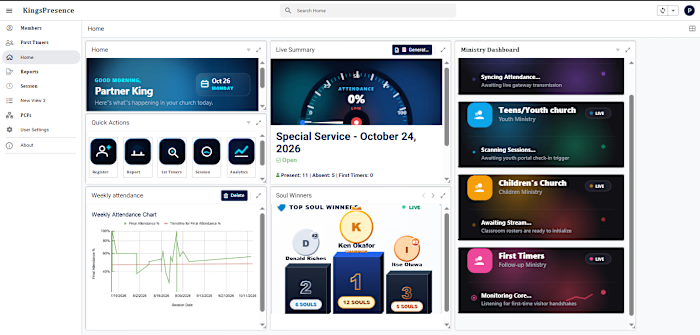
The home screen surfaces quick actions and per-ministry live status at a glance. Attendance percentage, weekly trendlines and a gamified "Soul Winners" leaderboard are computed through virtual columns and rendered as chart images, with no separate analytics database to maintain.
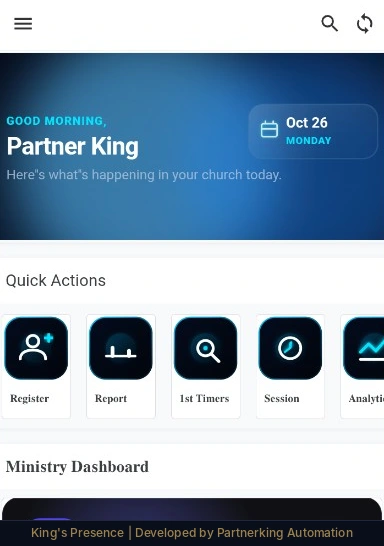
Home dashboard & quick actions
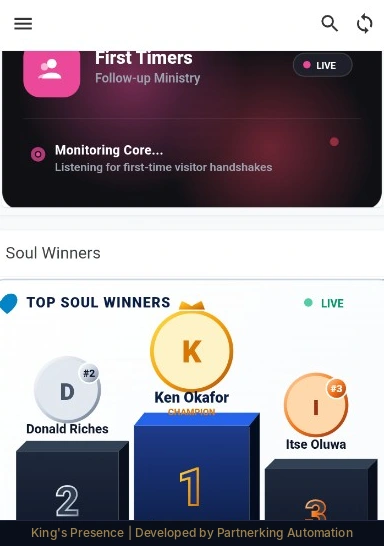
Gamified follow-up leaderboard
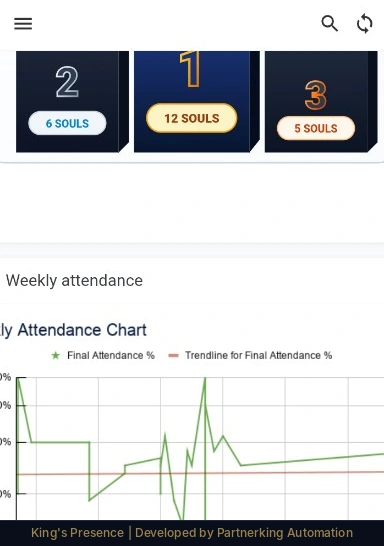
Weekly attendance trend
Attendance sessions
Each service is a session: open it, mark who is present, close it. A session-lock automation blocks new entries once a session closes, and present, absent and attendance-percentage figures recompute live as records come in.
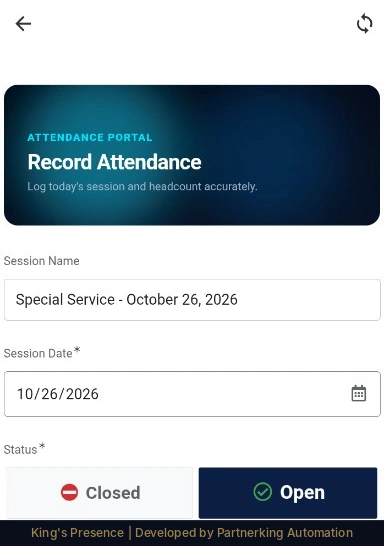
Open / close a session
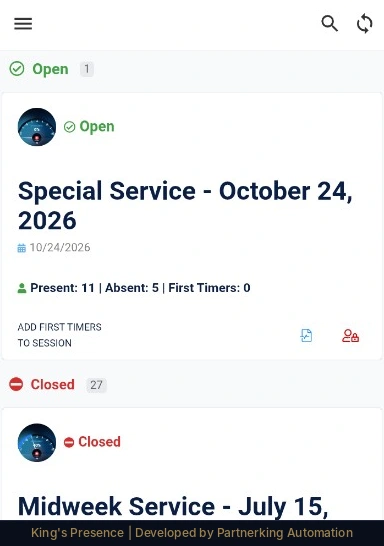
Session list, grouped by status
Live session summary
Member management
Every member has a structured record with cell group, PCF, contact details and an address geocoded for outreach planning. Absentees surface automatically per session, so follow-up never depends on memory.
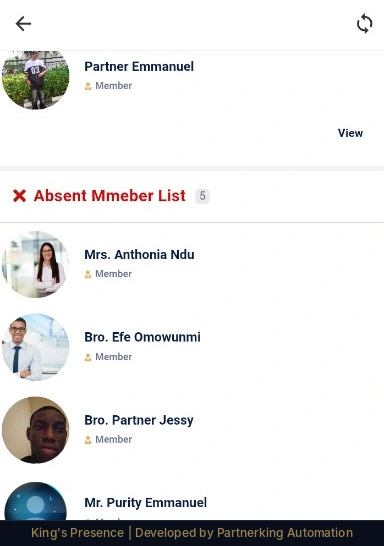
Automatic absentee list

Structured member profile
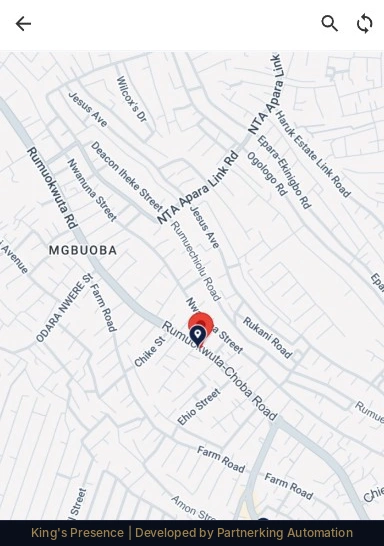
Geocoded addresses
Visitor pipeline & reporting
First-time visitors are captured with who invited them, then routed into a follow-up pipeline. A report bot compiles each session into a branded PDF, ready to send without anyone building it by hand.
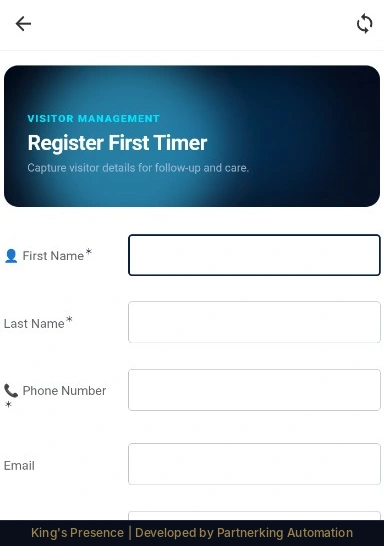
First-timer registration
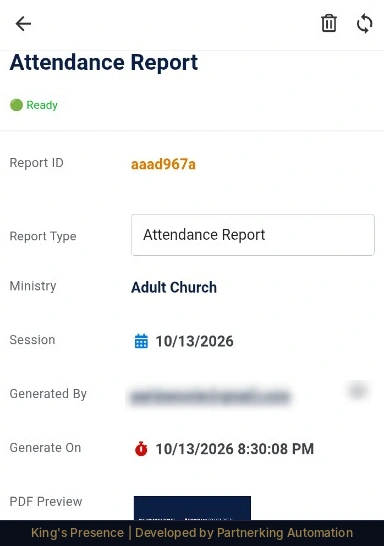
Auto-generated PDF report
Desktop view
On a desktop browser
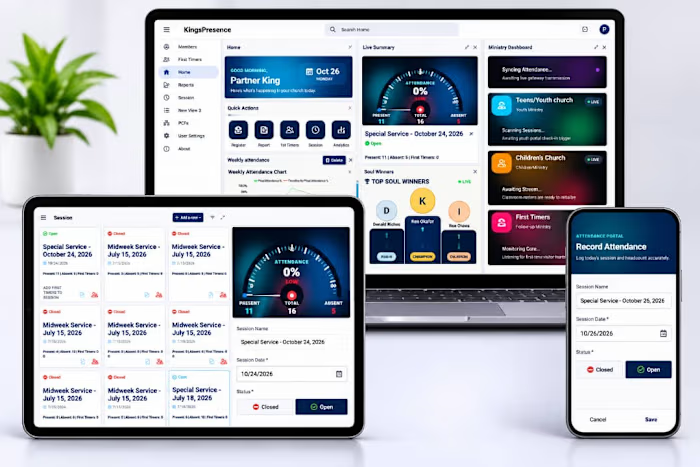
One AppSheet build serves both screens. On a wide display the same data opens as a workspace, with lists on the left and live detail beside them. Tap any screen to enlarge it.
Desktop view
Home dashboard: live summary, quick actions, weekly trend, Soul Winners and per-ministry status side by side.
Desktop view
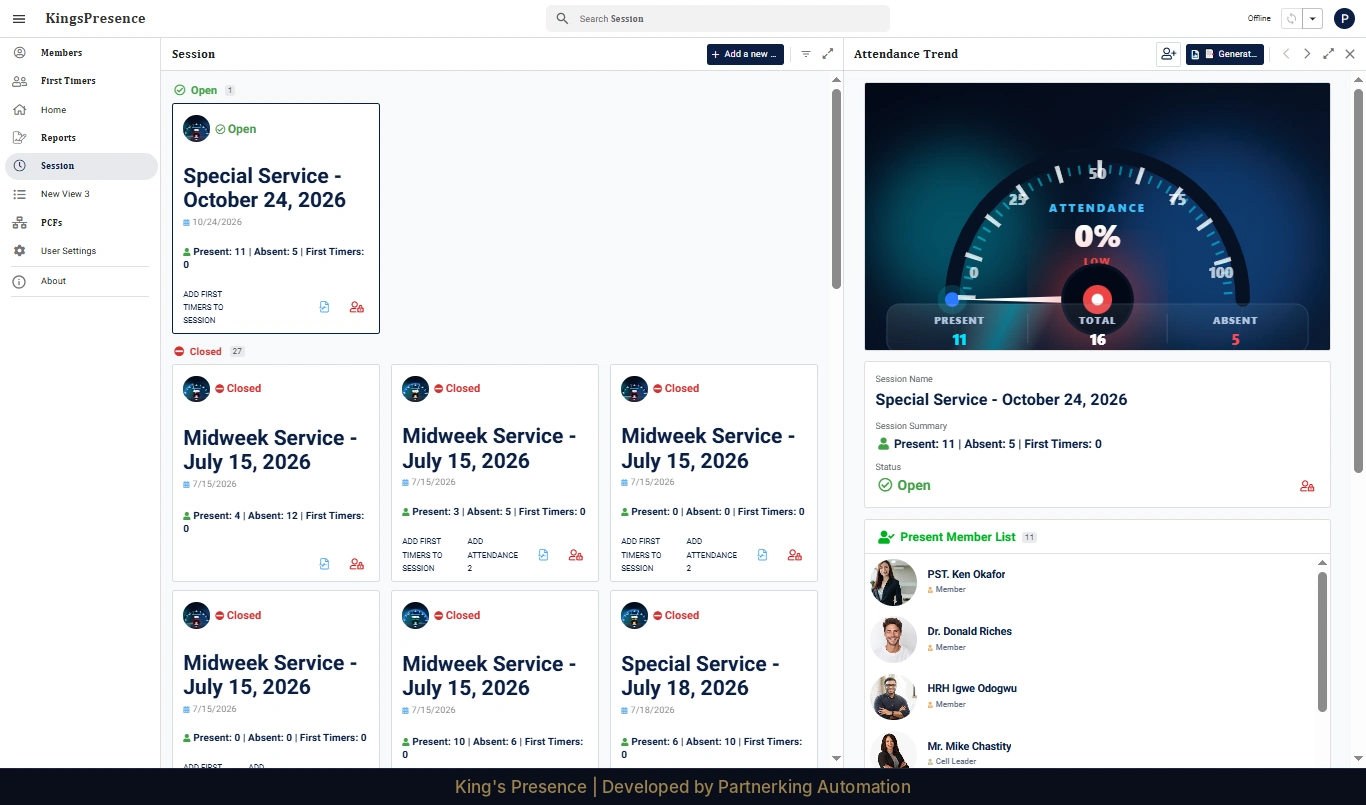
The open service: 11 present out of 16, with the present-member list beside the session list.
Desktop view
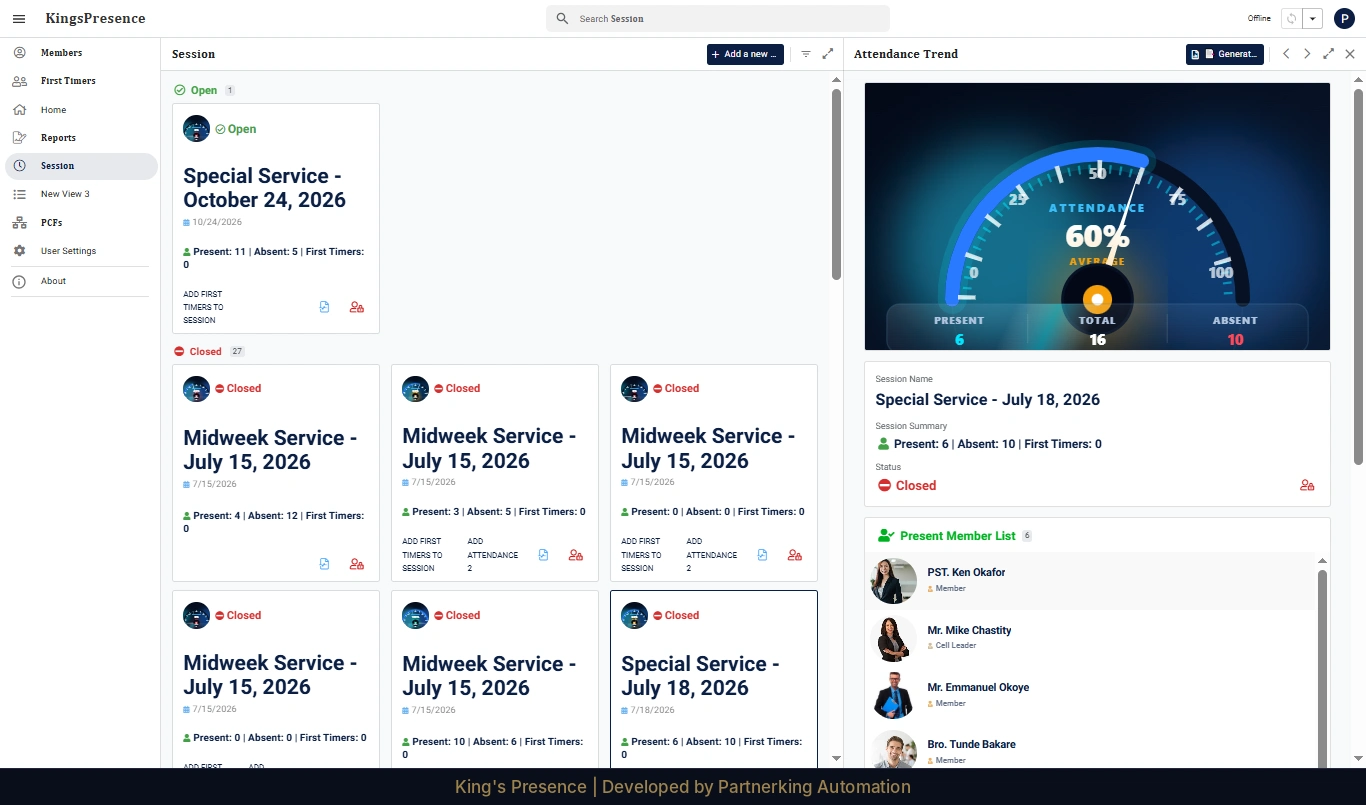
A closed service with its attendance gauge, present, absent and total counts.
Desktop view
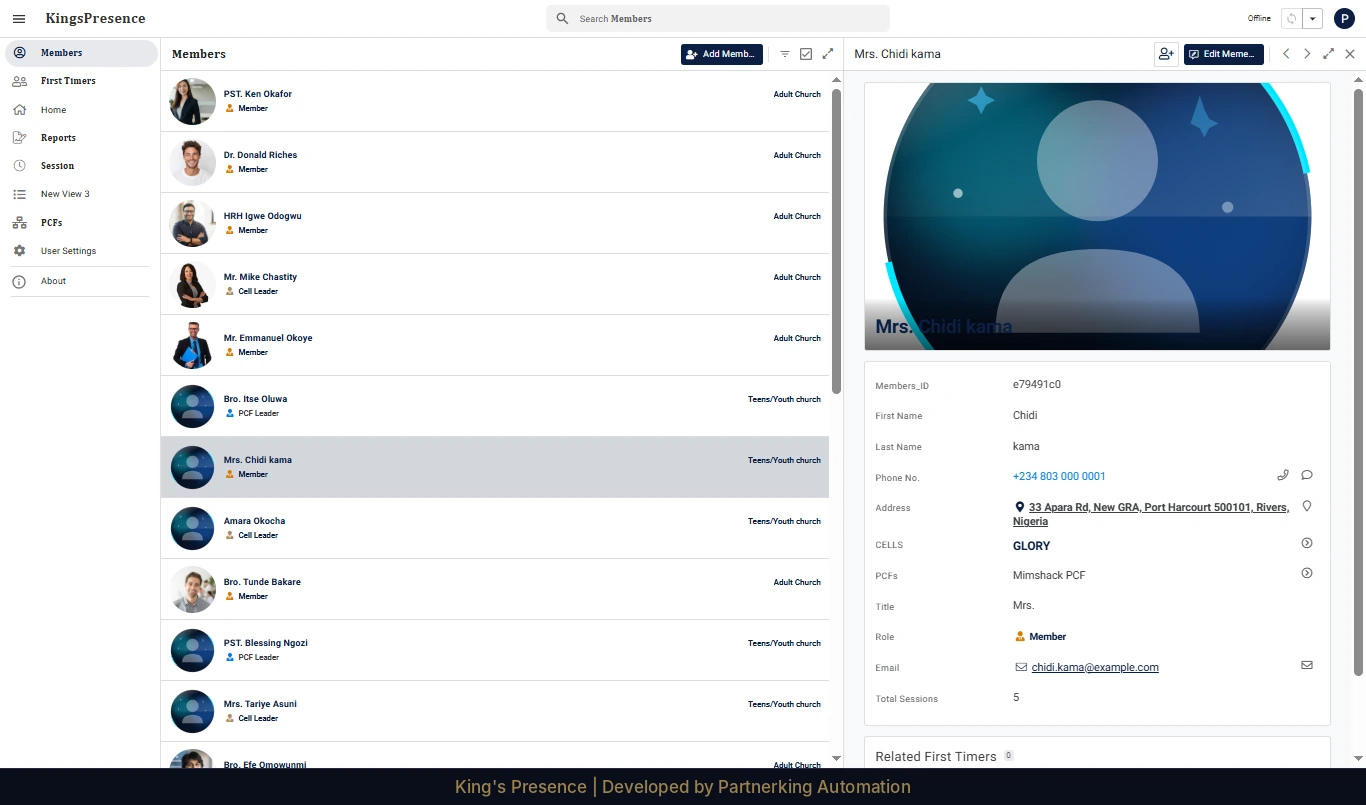
Member directory with the full profile open: cell, PCF, role, contact details and total sessions.
Desktop view
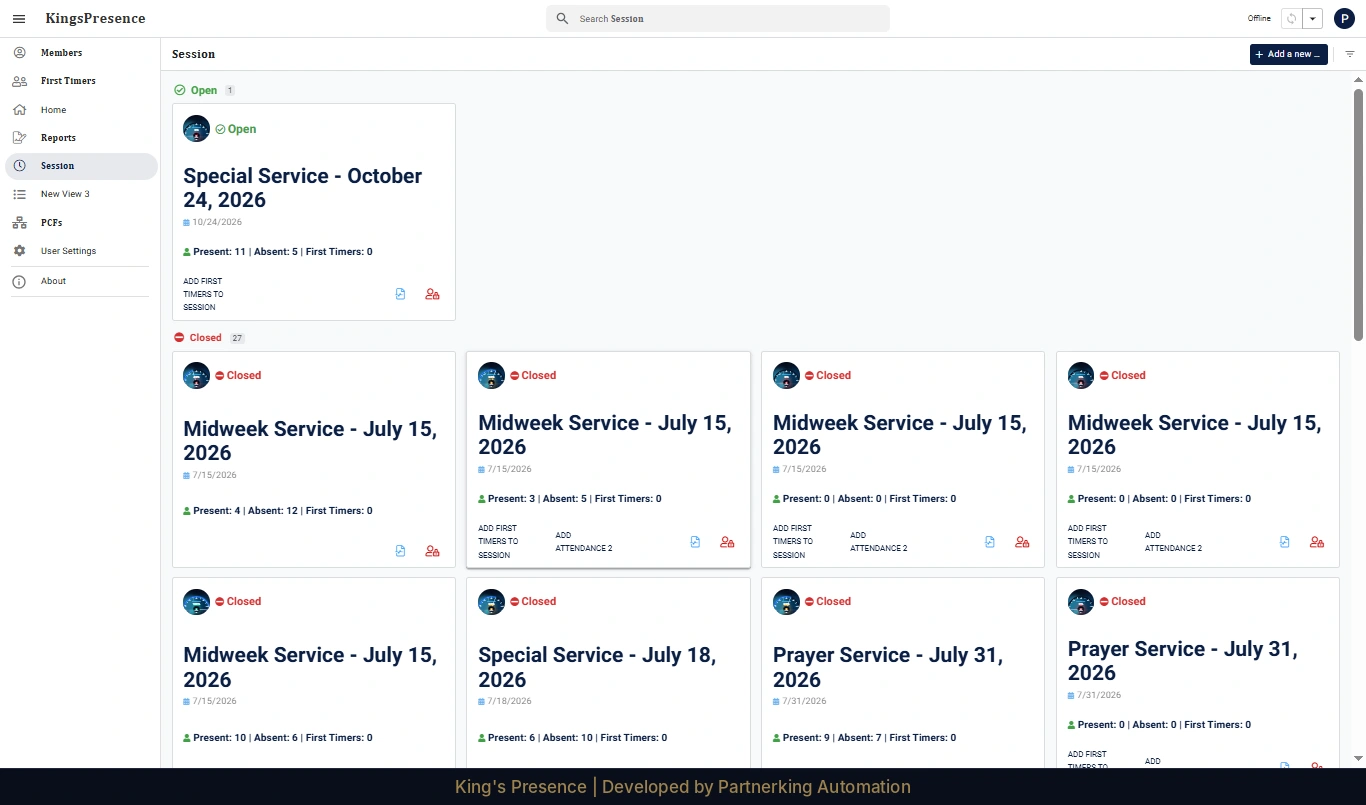
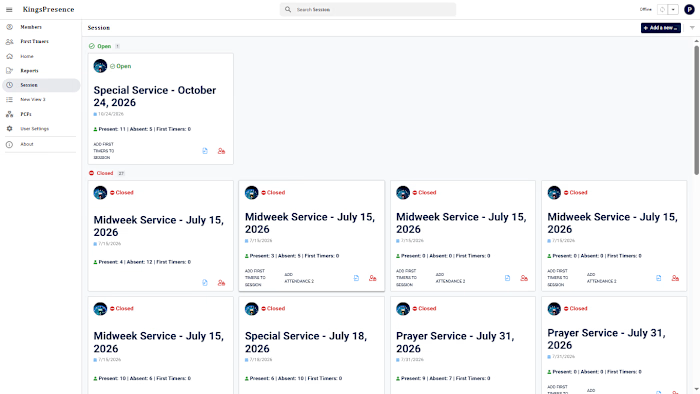
Sessions grouped by status: 1 open, 27 closed.
Demonstrated in this build
What's actually under the hood.
Virtual columns & formulas Security filters & user roles Bots & session-lock automation Google Sheets data architecture Custom brand theming Geolocation integration Chart-based data visualization Automated PDF reporting Google Apps Script Automated email
Proof of build
How it's built, and that it runs
Screenshots from the live King's Presence app, its Google Sheets database and its Apps Script automation. Tap any image to enlarge it.
Client data protected. These come from the live production app, so the records are left unchanged. Email addresses, file IDs and the church's name are blurred, and those images are marked "Data blurred". Every screenshot carries the footer "King's Presence | Developed by Partnerking Automation".
Data model
Tables for members, sessions, attendance, first timers, reports, PCFs and cells reference one another. Slices filter the data for each ministry and role.
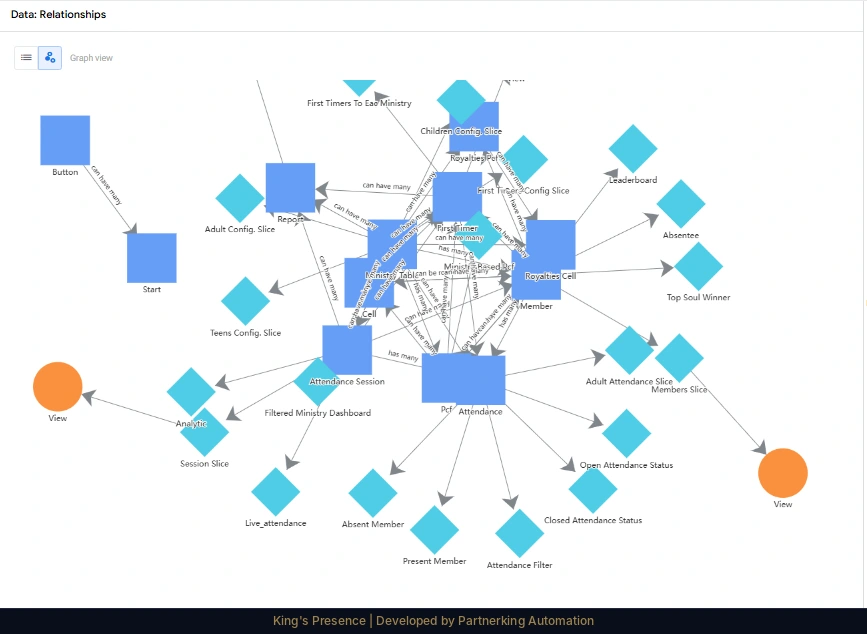
AppSheet's relationship graph: tables (squares), slices (diamonds) and views (circles) connected by references.
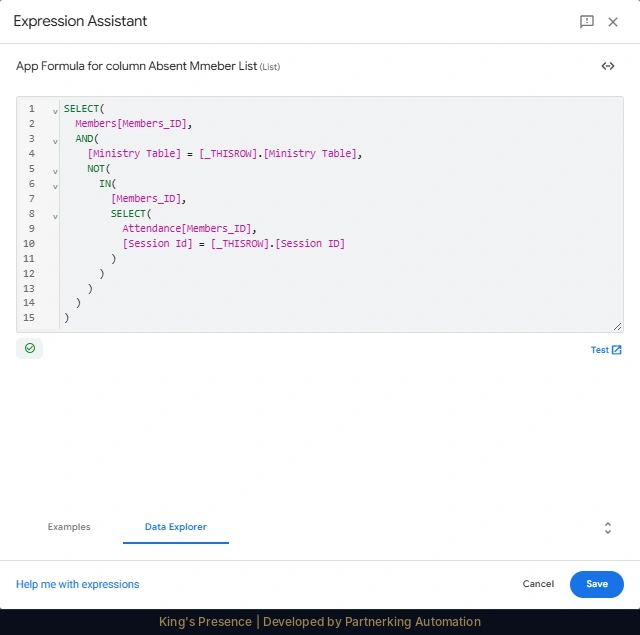
Absentee logic: members of the session's ministry who have no attendance record for that session.
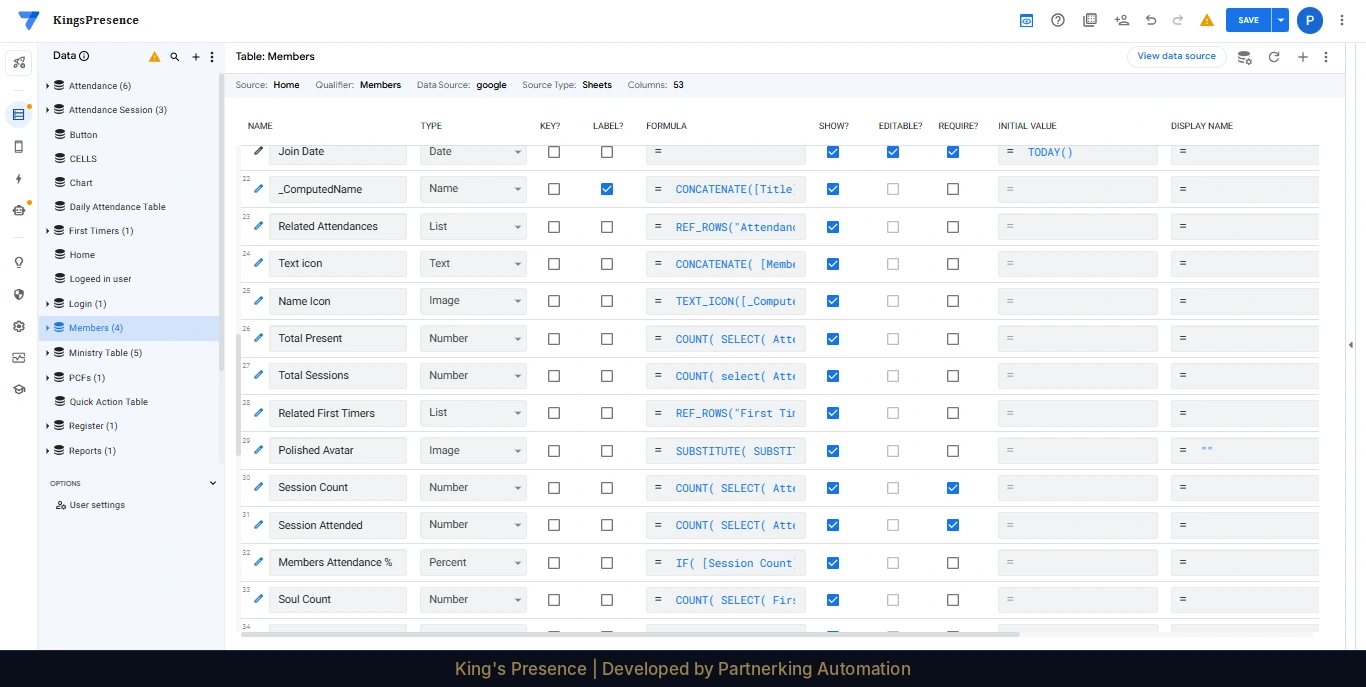
Members table, 53 columns. Formula columns such as Total Sessions, Session Attended, Members Attendance % and Soul Count are computed from related attendance and first-timer rows.
Database records
Google Sheets is the database. Each table is a sheet that the app reads and writes directly.
Data blurred
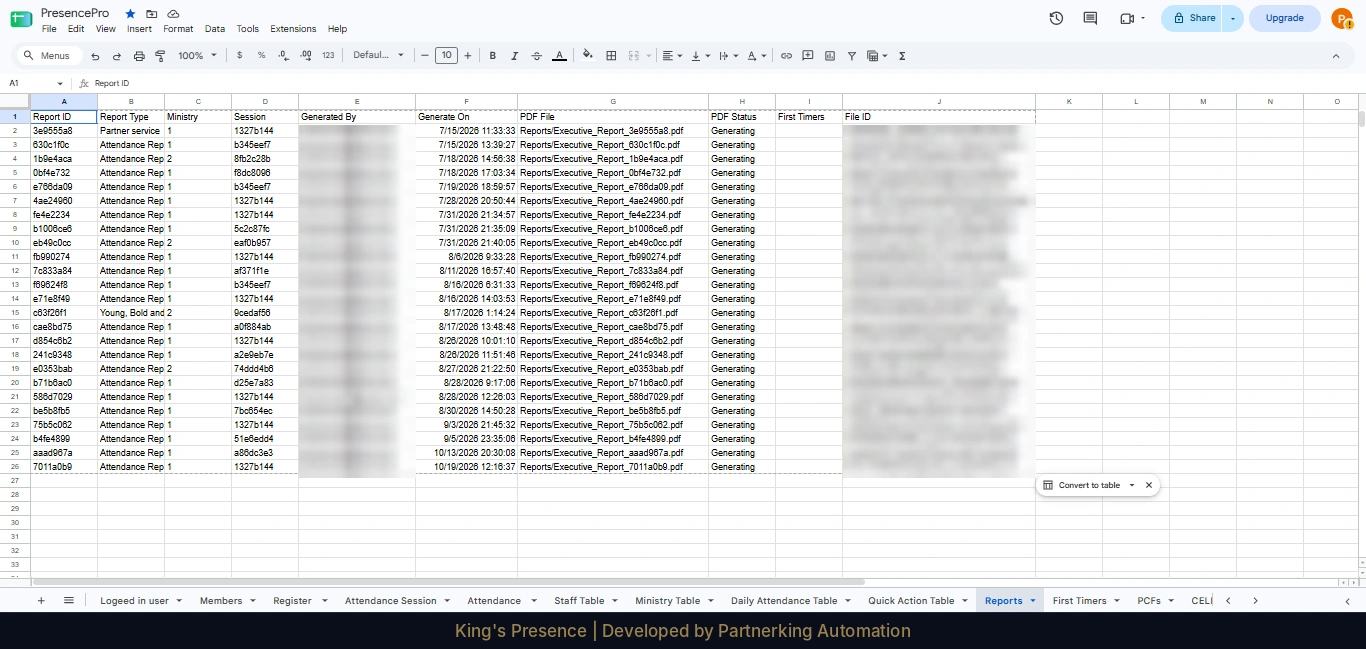
Reports sheet: one row per generated report, with type, ministry, session, time and PDF path. Generator emails and Drive file IDs are blurred.
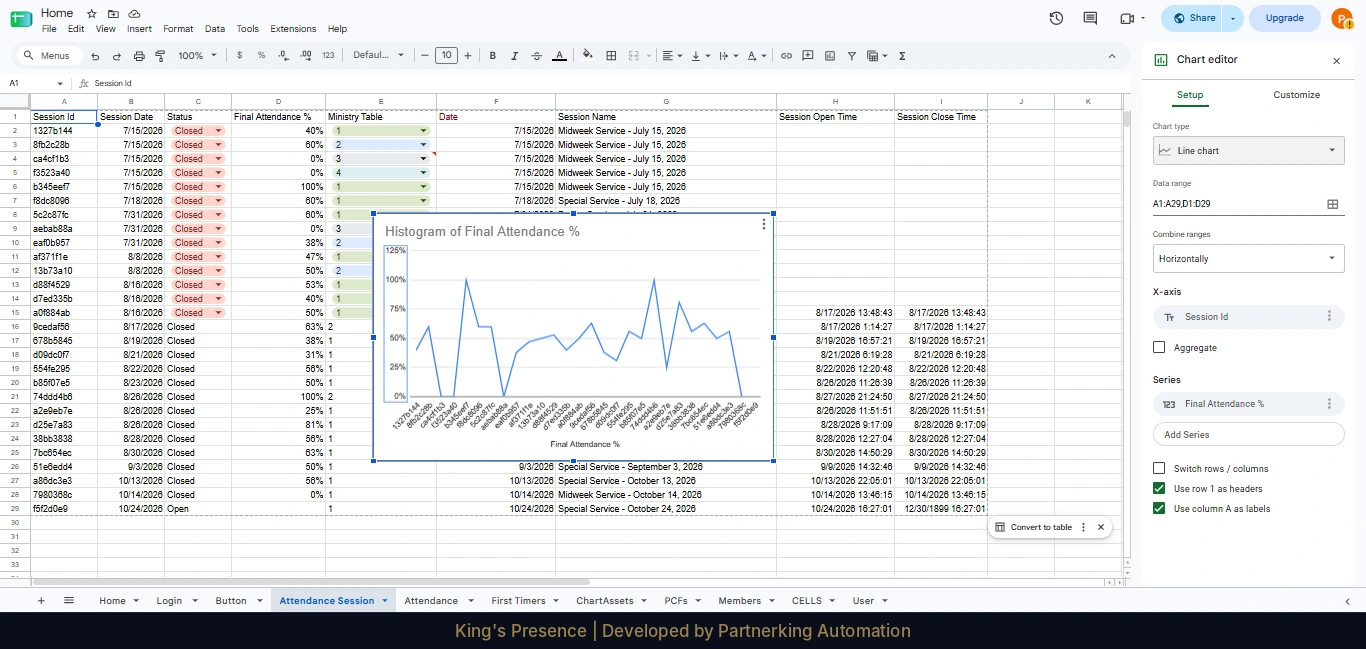
Attendance Session sheet: 28 sessions with status, final attendance % and open and close times, plus a trend chart drawn from the same rows.
Automation
A Google Apps Script finds each generated report PDF in Drive and saves its file ID against the report row, so the app can open the file. First-time visitors get a branded welcome email.
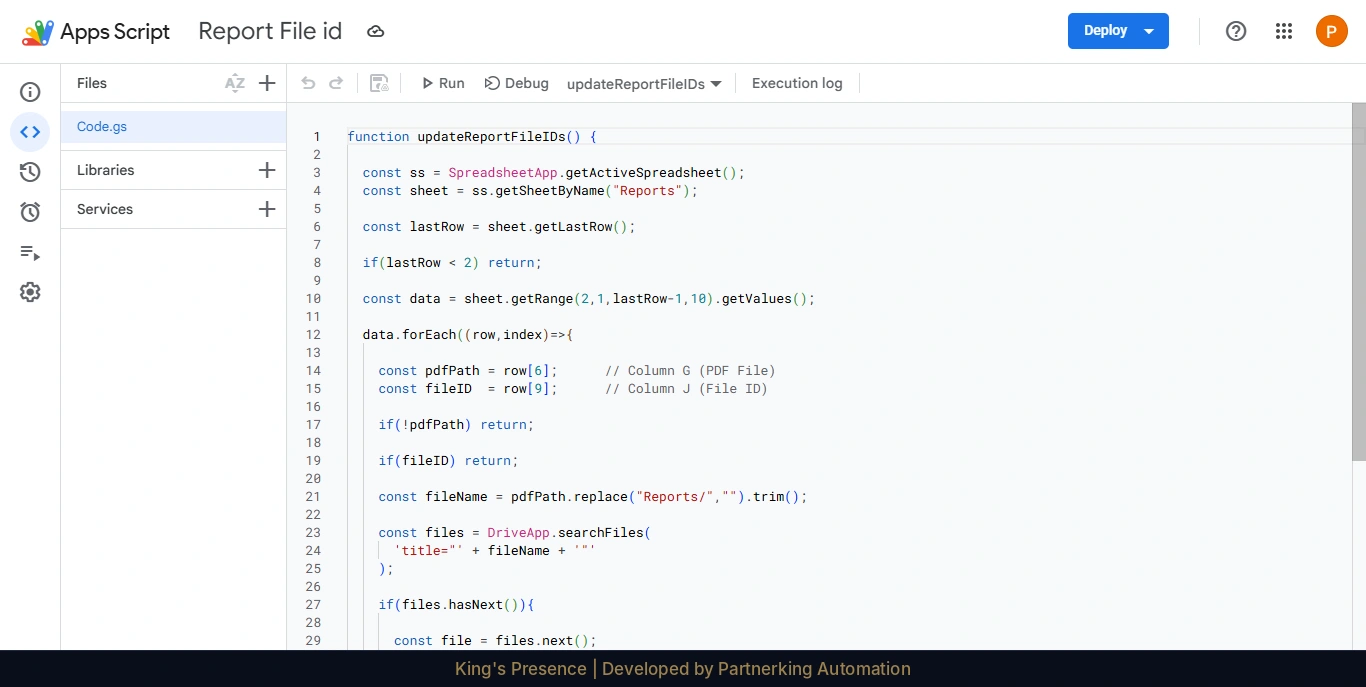
updateReportFileIDs in Apps Script: reads the Reports sheet, skips rows that already have a file ID, and looks up the PDF in Drive by file name.
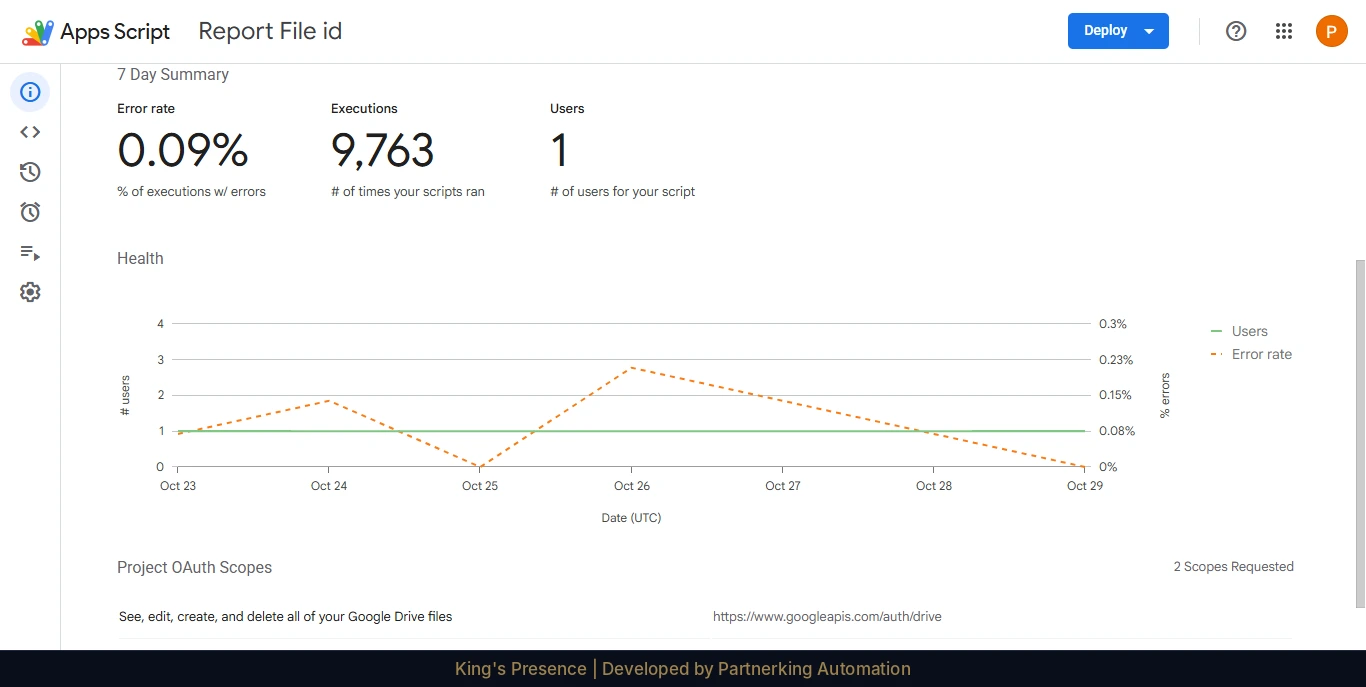
Apps Script dashboard for the last 7 days: 9,763 executions with a 0.09% error rate.
Data blurred
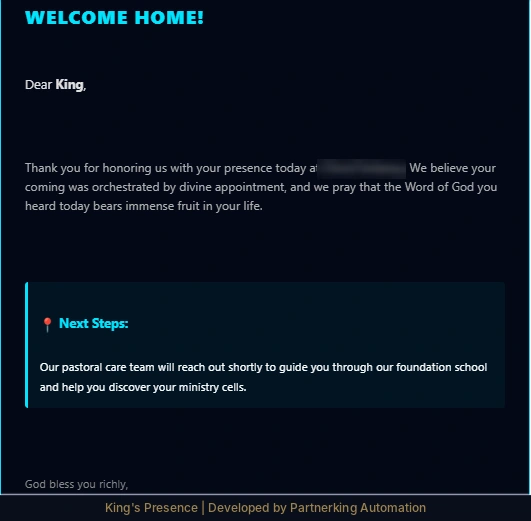
Welcome email sent automatically to a first-time visitor. The church name is blurred.
Data visualization
Charts and cards are built from formulas inside the app, so there is no separate analytics tool to maintain.
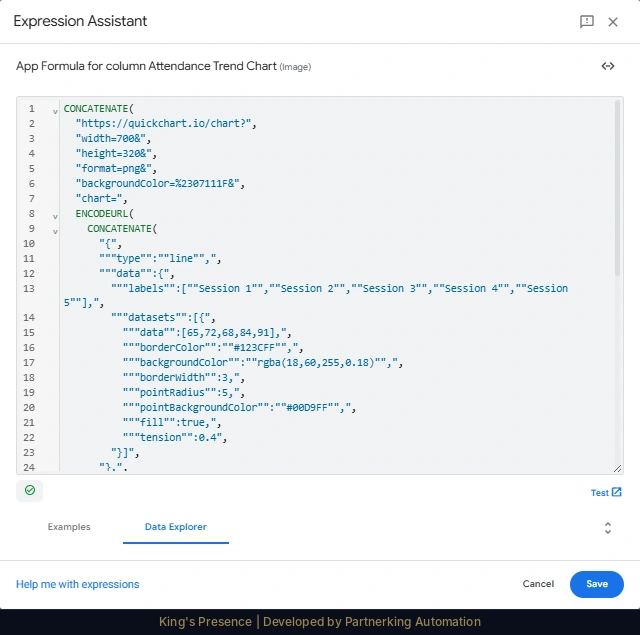
Chart image built by an expression: AppSheet assembles a QuickChart URL and shows the result as an image column.
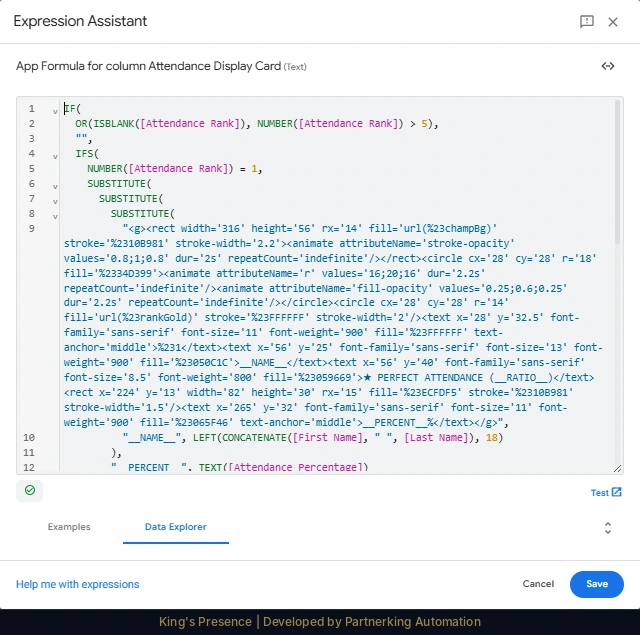
Leaderboard card drawn as an animated SVG inside an expression, filled with each member's name and attendance percentage.
Like this project
Posted Oct 31, 2026
An end-to-end AppSheet church attendance and member-engagement platform with live analytics, automated reporting and workflow automations.
Likes
0
Views
0
Tags