Power BI Sales Data Analysis
Christopher usen
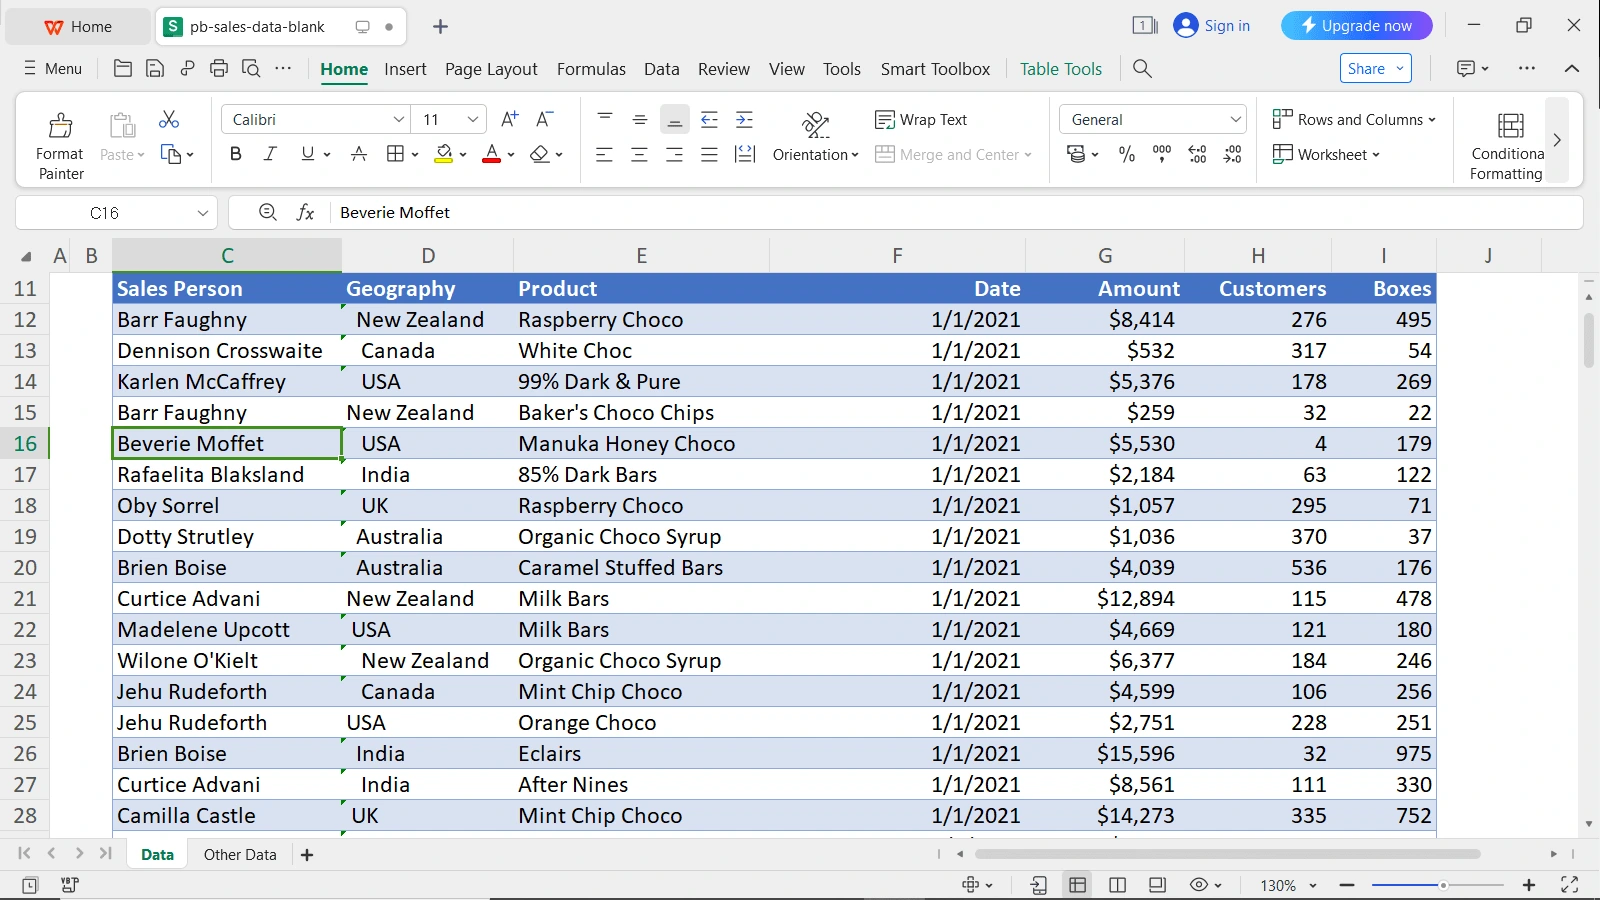
Awesome Chocolate Sample Data Analysis XLSX
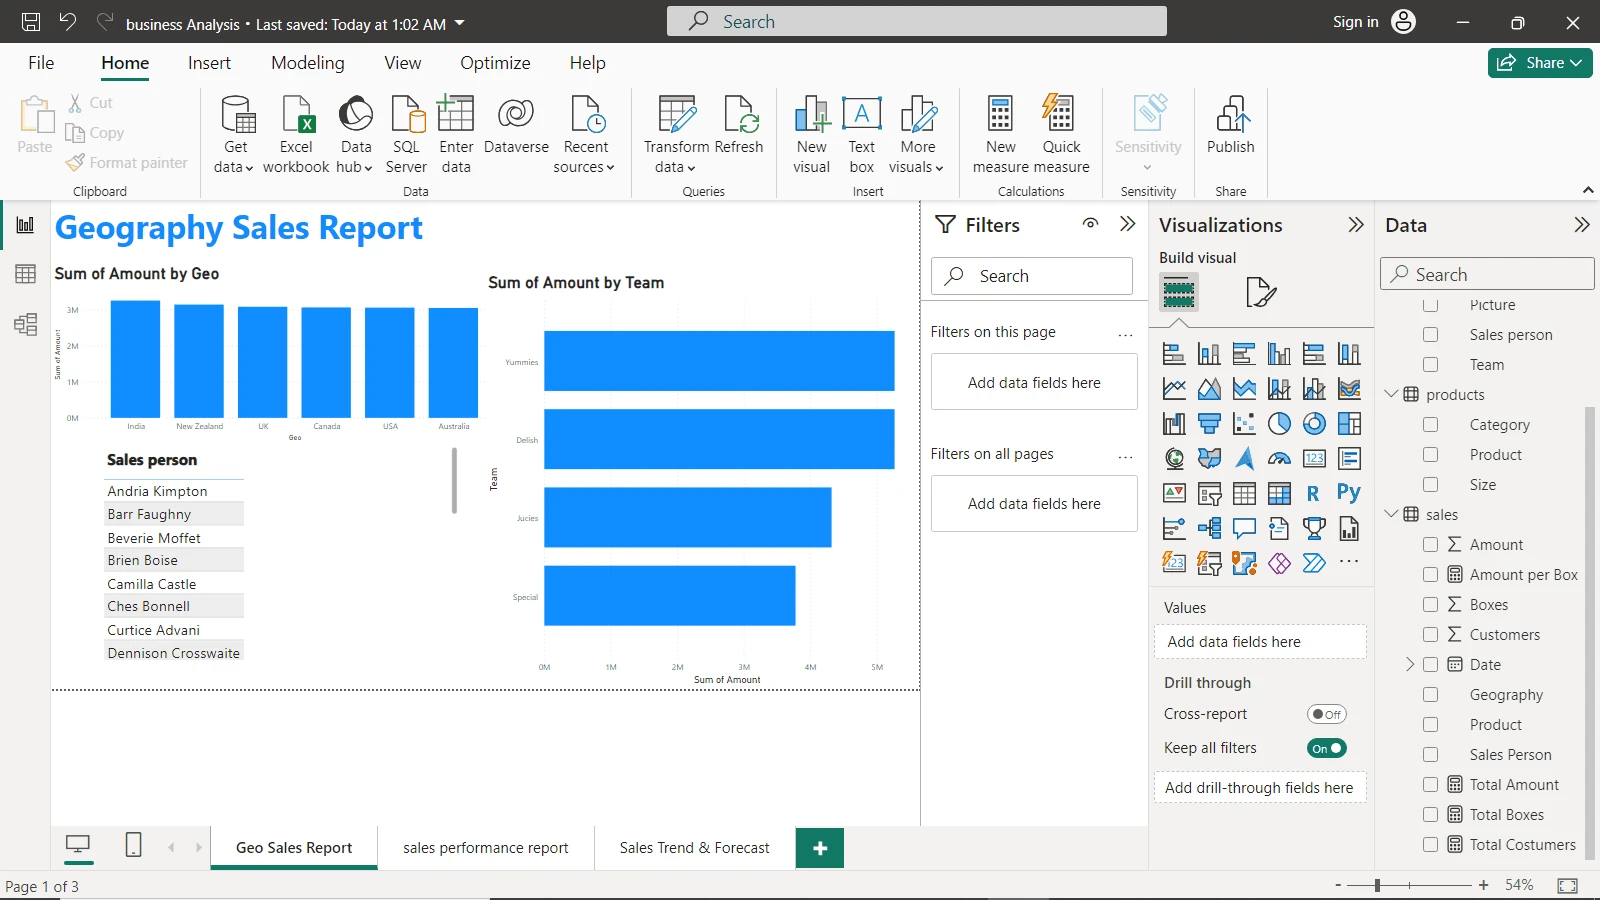
Analysis overview of the Geography Sales Report
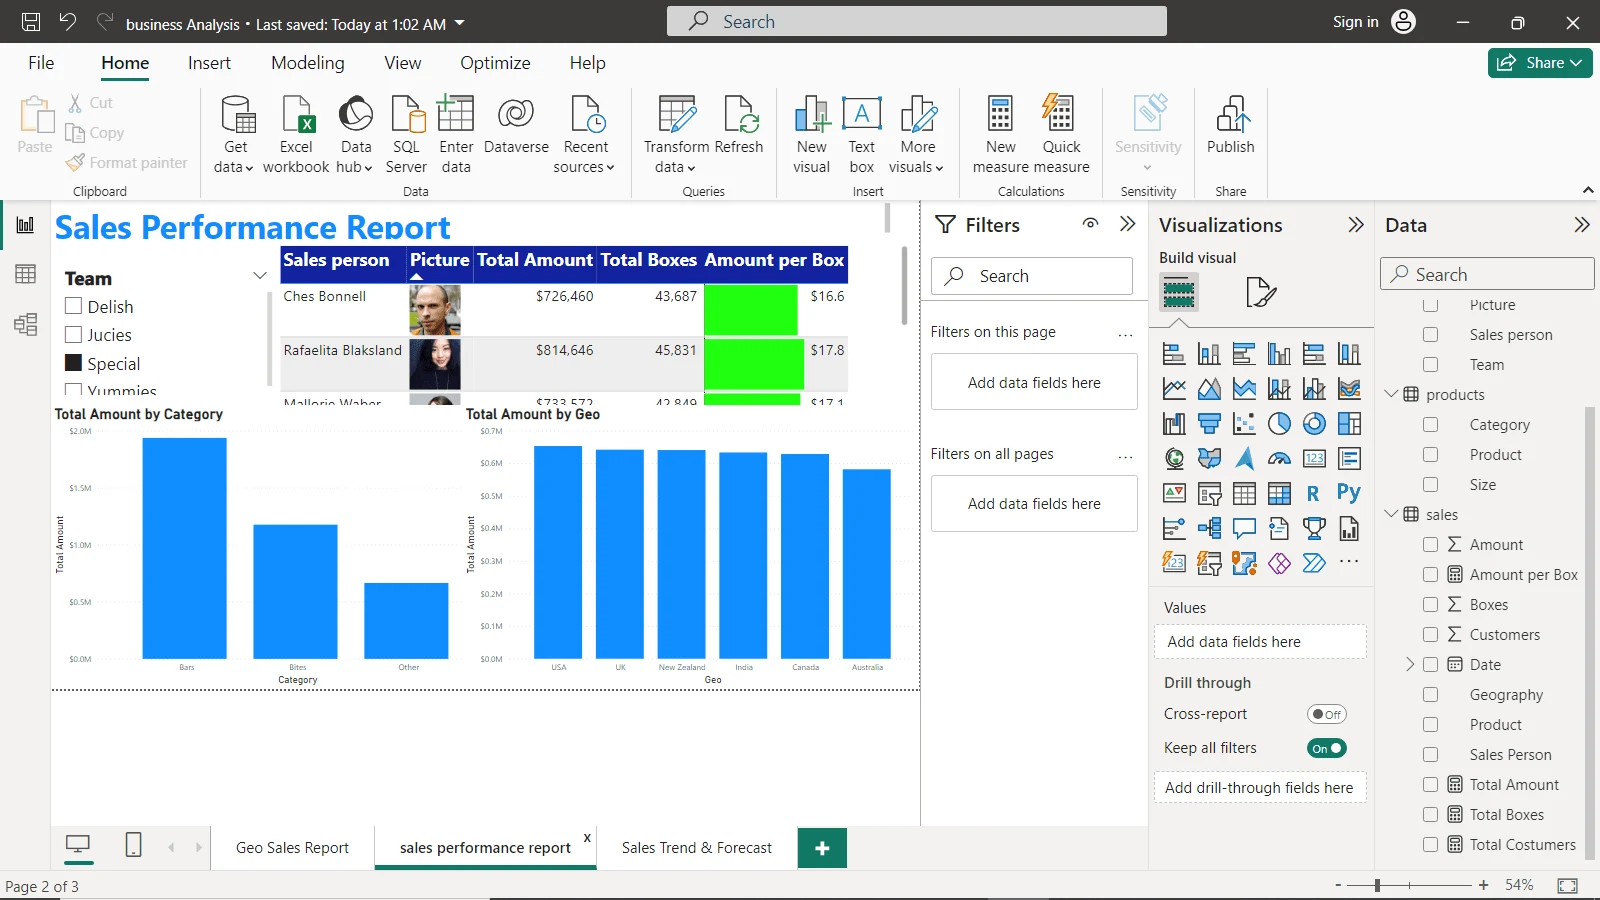
Sales Performance Report
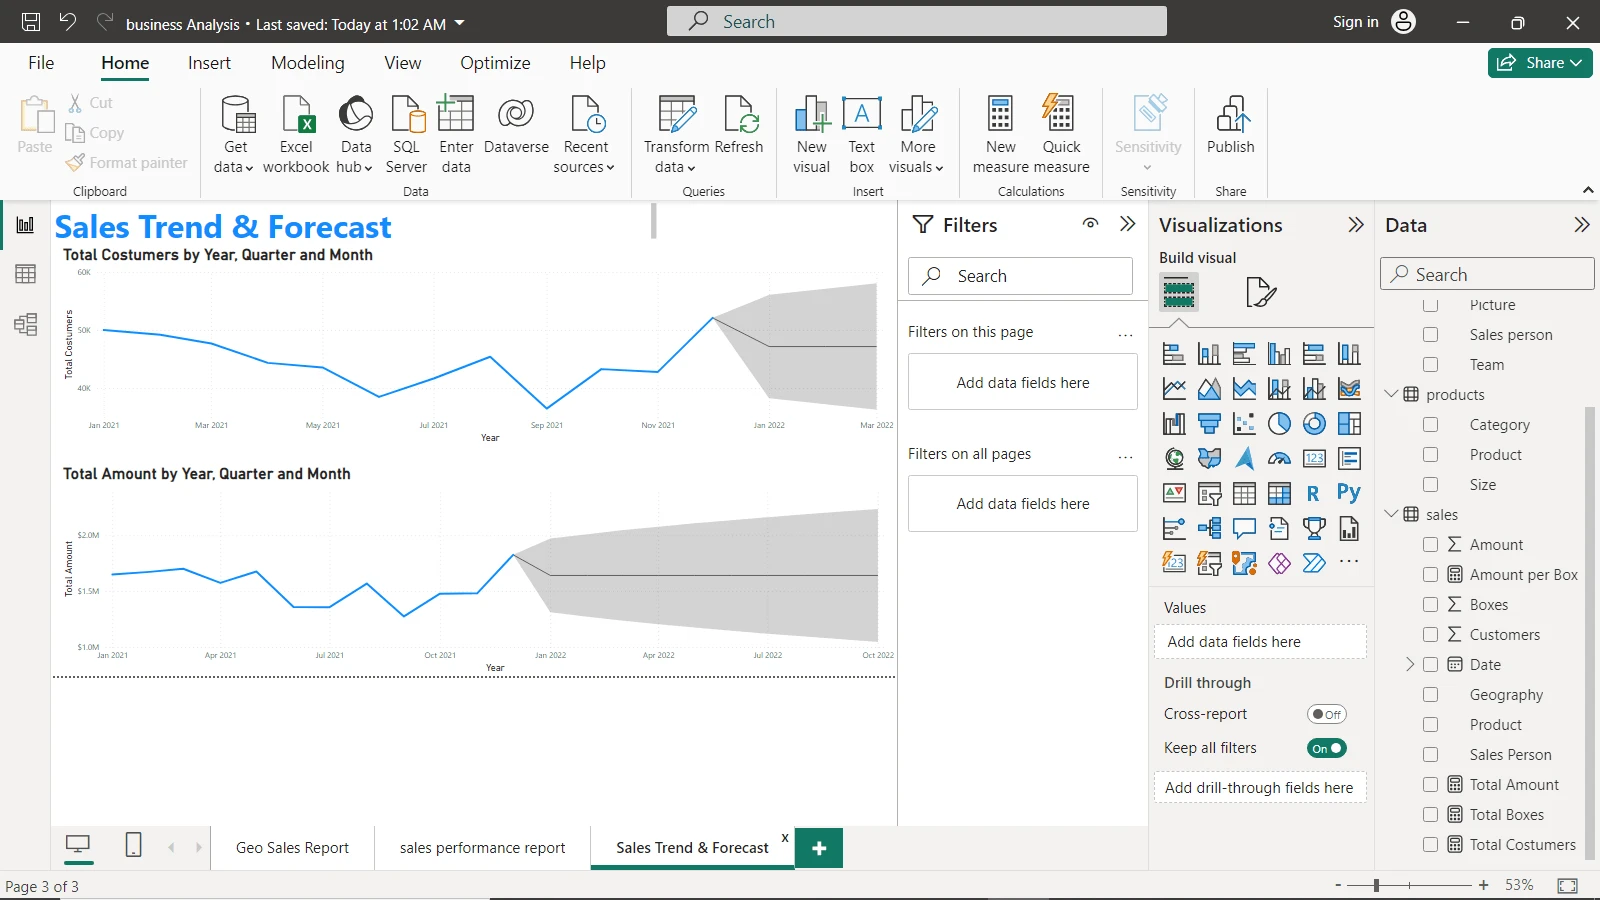
Sales Trend & Forecast Report
The project above describes an interactive Power BI Data analysis sales report. The objective of this project was to analyze and derive insight from a company(Awesome Chocolate) sales data stored in an excel file. In this excel file contains sales data from the date of 2021, in which I was asked to make an insightful and interactive report on: How the company sold to each of the Geography they operate in as identified on the excel table, a report on the total amount by individual sales persons, analyzing and generating report on the performs of each sales persons and lastly to plot out sale trend and future price forecast. I was able to achieve these requirements through the use of a data visualizing tool, Power BI.
Like this project
Posted Feb 18, 2024
Interactive Power BI Data analysis operation on sales data for insightful report.
Likes
0
Views
9