
🚀 Completed a Kubernetes Monitoring Project with Prometheus & Grafana
As part of my DevOps learning journey, I completed a hands-on Kubernetes monitoring project where I deployed and monitored a Kubernetes environment using Helm, Prometheus, and Grafana.
🔧 Technologies Used:
• Kubernetes & Minikube
• Helm
• Prometheus
• Grafana
• Node Exporter
• Kube State Metrics
📌 What I implemented:
• Deployed Prometheus and Grafana using Helm
• Monitored Kubernetes pods and services
• Collected node and cluster metrics
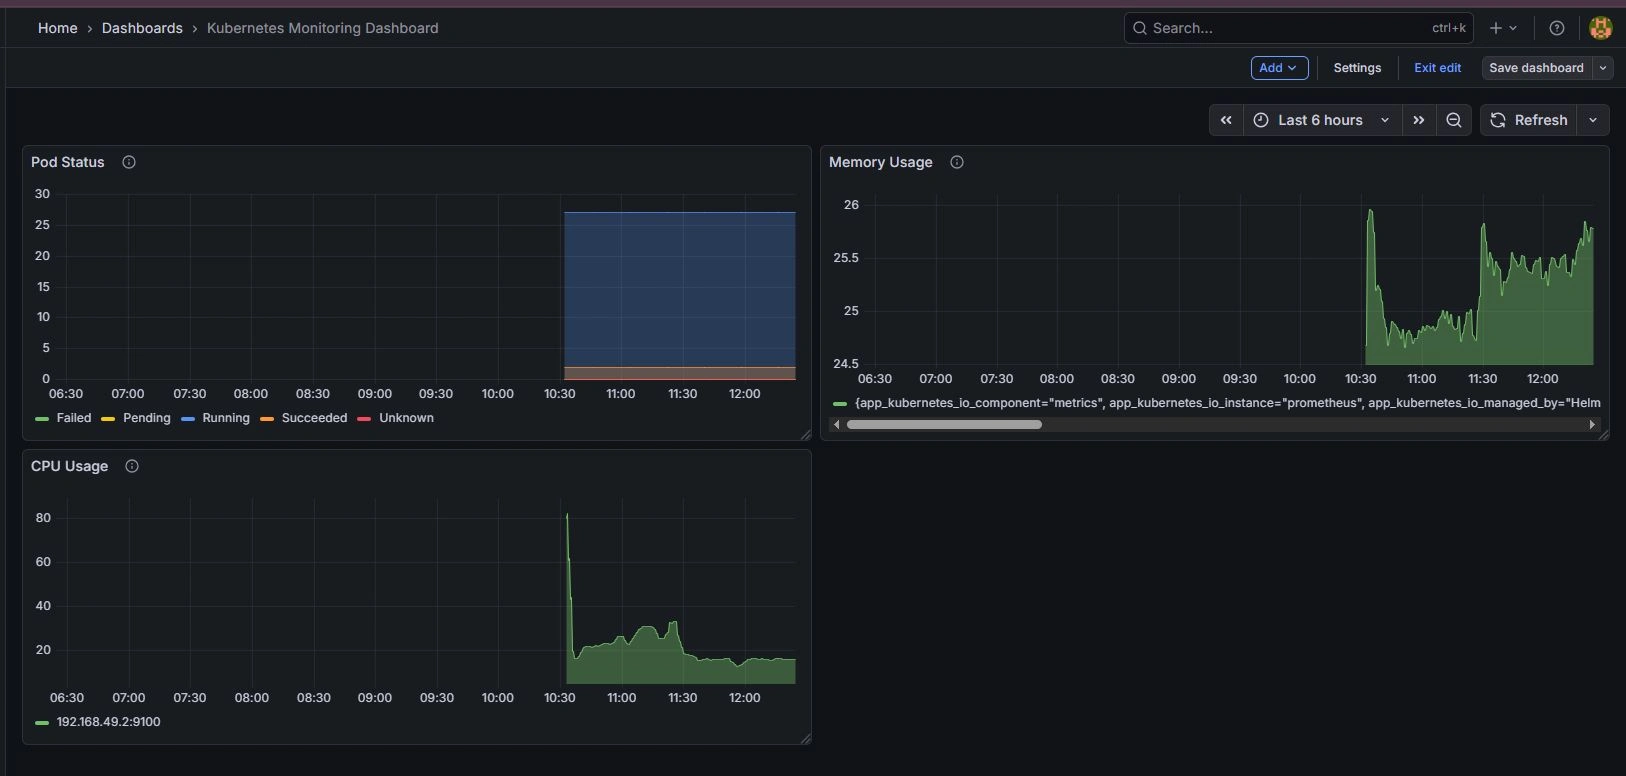
• Created a Grafana monitoring dashboard
• Monitored CPU, memory, and pod status
• Created PromQL queries for monitoring
• Configured a High CPU Usage alert (CPU > 80%)
• Verified deployments using kubectl get pods, kubectl get svc, and helm list
📸 Screenshots below show the actual implementation, including Kubernetes resources, Helm releases, Grafana dashboard, and alert configuration.
This project helped me strengthen my understanding of Kubernetes monitoring, observability, Prometheus, Grafana, Helm, and alerting
Currently continuing my journey toward becoming a Junior DevOps Engineer, focusing on Kubernetes, CI/CD, cloud technologies, monitoring, and automation.
hashtag#DevOps hashtag#Kubernetes hashtag#Prometheus hashtag#Grafana hashtag#Helm hashtag#Monitoring hashtag#Minikube hashtag#CloudComputing hashtag#DevOpsJourney
0 likes · 0 views · Sep 17, 2026
🚀 Completed a Kubernetes Monitoring Project with Prometheus & Grafana As part of my DevOps learning journey, I completed a hands-on Kubernetes monitoring pr...


