
Power BI
June 2022
Examined Call center trends to provide information on how to visualize consumer behavior and agent performance.
Constructed a dashboard where I had to assess the number of clients who churned in order to improve customer retention.
Developed a visualization with data on turnover, diversity and inclusion, hiring, promotion, performance, and KPI for employees.
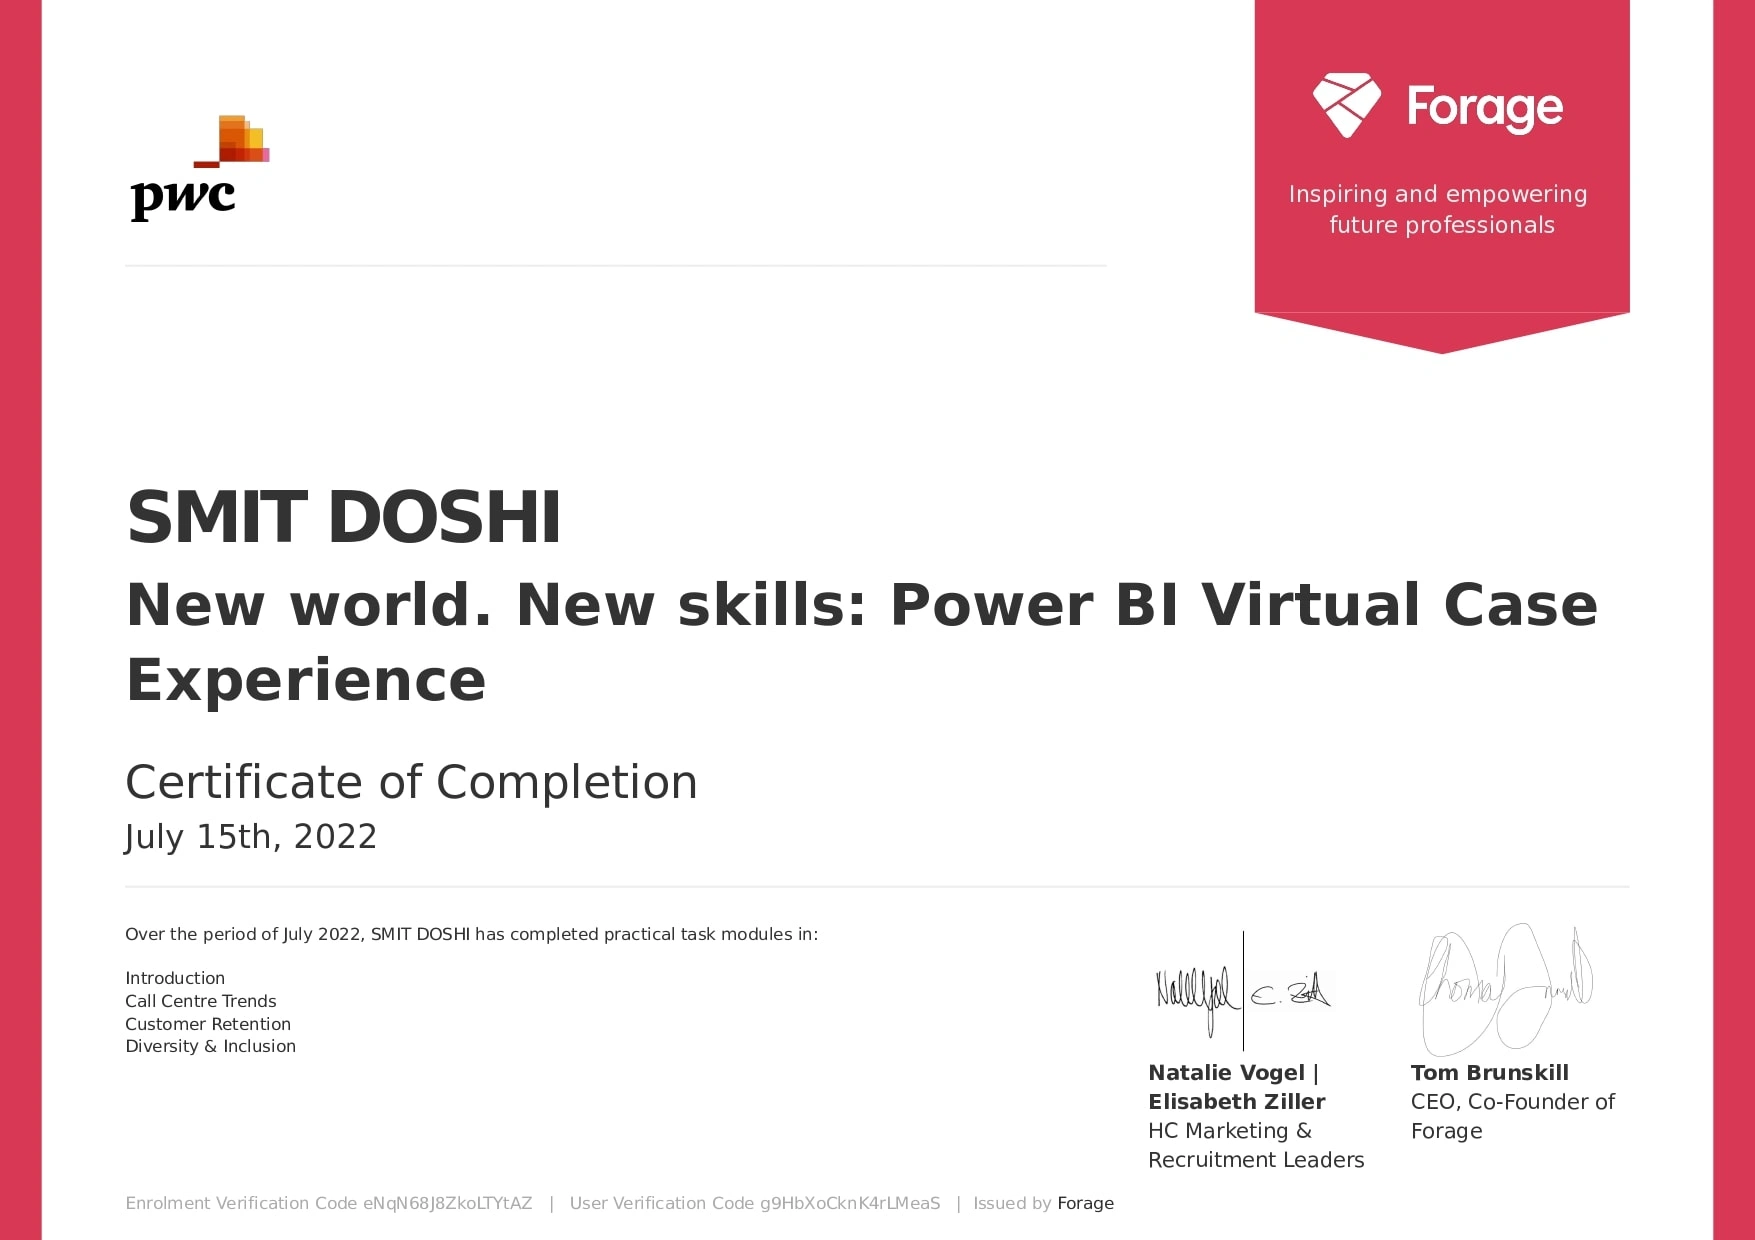
Certificate
0 likes · 61 views · Feb 9, 2023
Examined trends to provide information on how to visualize consumer behavior, agent performance and company's progress.


