What-if Analysis Dashboard

Jerry Yang

Data Analytics
What-if Analysis Dashboard
Business intelligence dashboard for revenue, profit, occupancy, and operating leverage scenarios.
About This Project
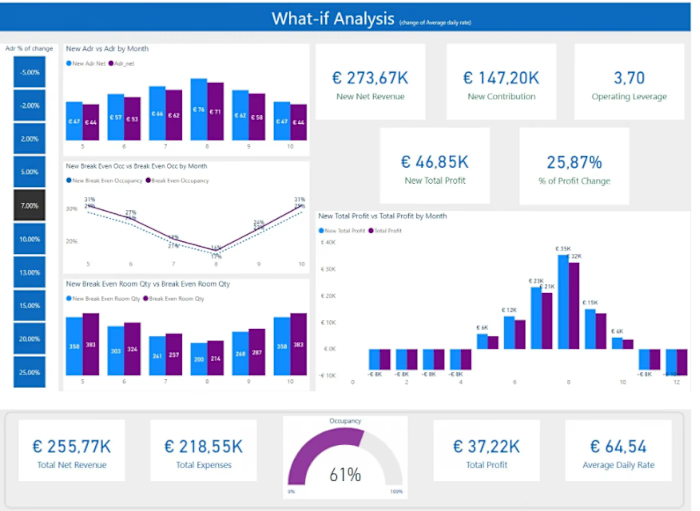
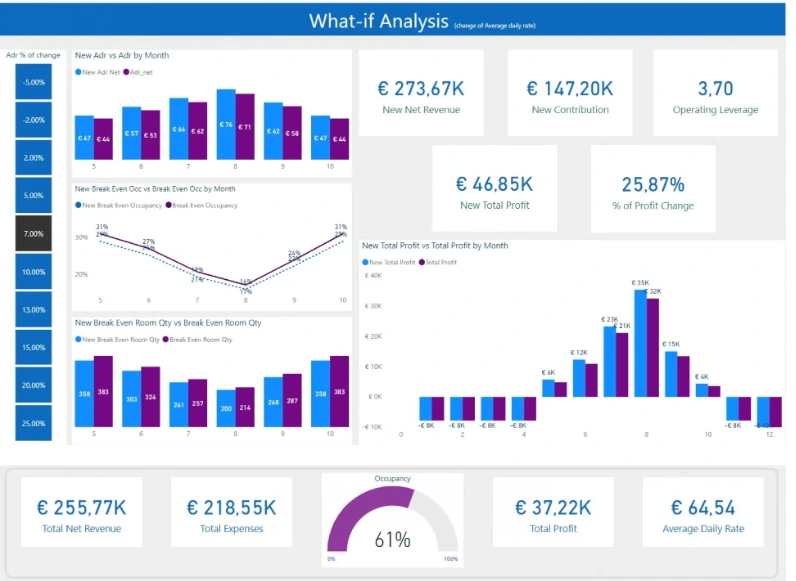
Designed a what-if analysis dashboard that lets business users compare how changes in average daily rate affect net revenue, contribution, profit, occupancy, and operating leverage. The report combines KPI cards, trend charts, and month-by-month comparisons to make financial scenarios easier to evaluate.
Key Features
Scenario controls for rate-change assumptions
Revenue, expense, profit, and occupancy KPI cards
Monthly comparisons across forecasted metrics
Break-even occupancy and room quantity analysis
Clear executive summary layout
Reusable model for hospitality and revenue planning
Project Information
CategoryData Analytics
Year2025
Technologies
Power BIDAXForecastingKPI Modeling
Like this project
Posted Jul 7, 2026
What-if analysis dashboard to compare changes in rates across net revenue, contribution, profit, occupancy, and operating leverage with month-by-month reports.
Likes
0
Views
0