Handshake - AI Outlook Interactive Report
Yash Bajaj
The brief
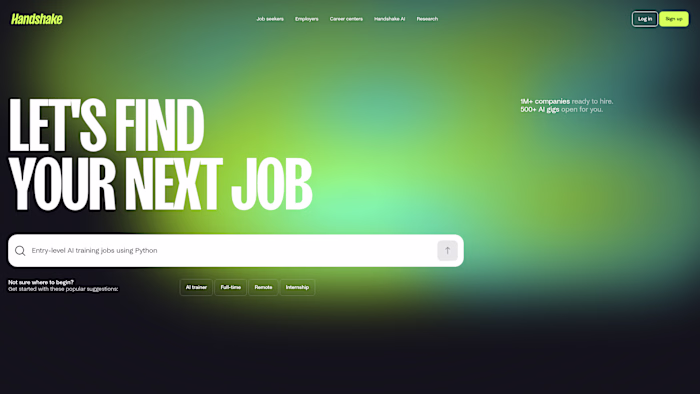
Handshake's economic research team publishes data-driven reports on the early-career labor market. For their Class of 2026 AI Outlook report, they needed an interactive visualization that could bring resume data to life: each dot representing a sampled resume, clustered by AI keyword usage, and explorable by the reader.
The challenge wasn't just building a chart. It was building a chart that the content team could position anywhere on the page without developer intervention.
The bee-swarm visualization
I built the interactive bee-swarm chart from scratch using D3.js. Each dot represents a sampled resume from the Class of 2026 and Class of 2022, plotted to show how AI keywords have spread across graduating classes. The visualization supports hover states, transitions between data views, and responsive scaling.
The data tells a striking story: AI adoption went from split to near-universal in two years, with 85% of 2026 seniors using AI tools compared to roughly half of the 2024 class.
The architecture decision: React Portal + Sanity
Here's where it gets interesting. The report page is built in Next.js with content managed through Sanity CMS. The research team needs to control the layout of every report, including where interactive elements sit relative to text, charts, and callouts.
I rendered the D3 visualization through a React Portal, which lets the chart live inside the React component tree while being mounted at a DOM node that Sanity controls. The content editors place a custom block in Sanity's editor, and the Portal renders the full interactive D3 chart at that exact position on the page.
The result: a custom data visualization that behaves like any other content block. The research team can move it, reorder sections around it, or place it between paragraphs, all without touching code.
The full report
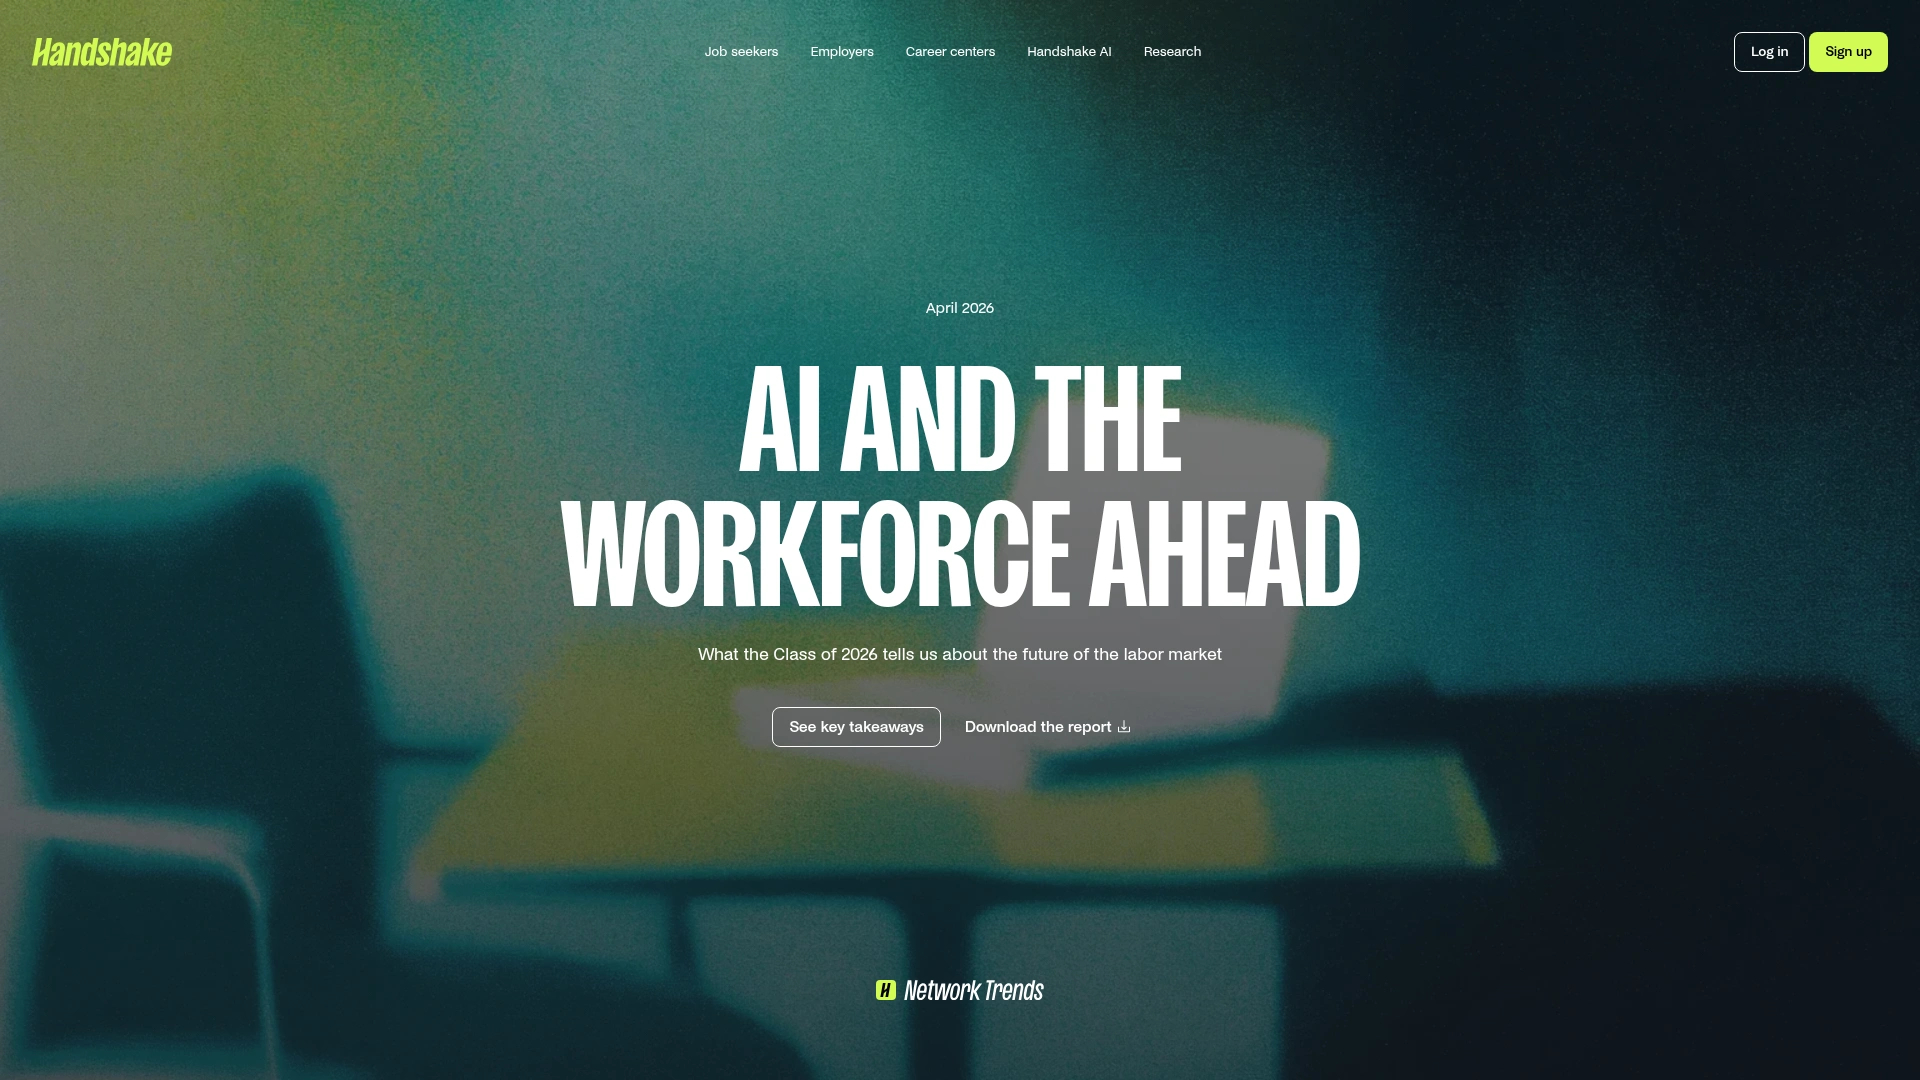
The report itself includes multiple data visualizations (Datawrapper embeds for standard charts alongside the custom D3 work), a sticky navigation sidebar, downloadable PDF, and a responsive layout that handles the density of an academic-style research piece while keeping it visually engaging.
The report covers AI adoption rates, job market trends, employer demand for AI skills, the classroom-workforce gap, and how students are learning AI outside formal education. It was authored by Handshake's Head of Economic Research and published April 2026.
Like this project
Posted May 20, 2026
Built a custom D3.js bee-swarm visualization for Handshake's Class of 2026 AI Outlook report, rendered through a React Portal and positioned via Sanity CMS.