Aetheris: Live Telemetry Anomaly Detection

Colin Stephenson


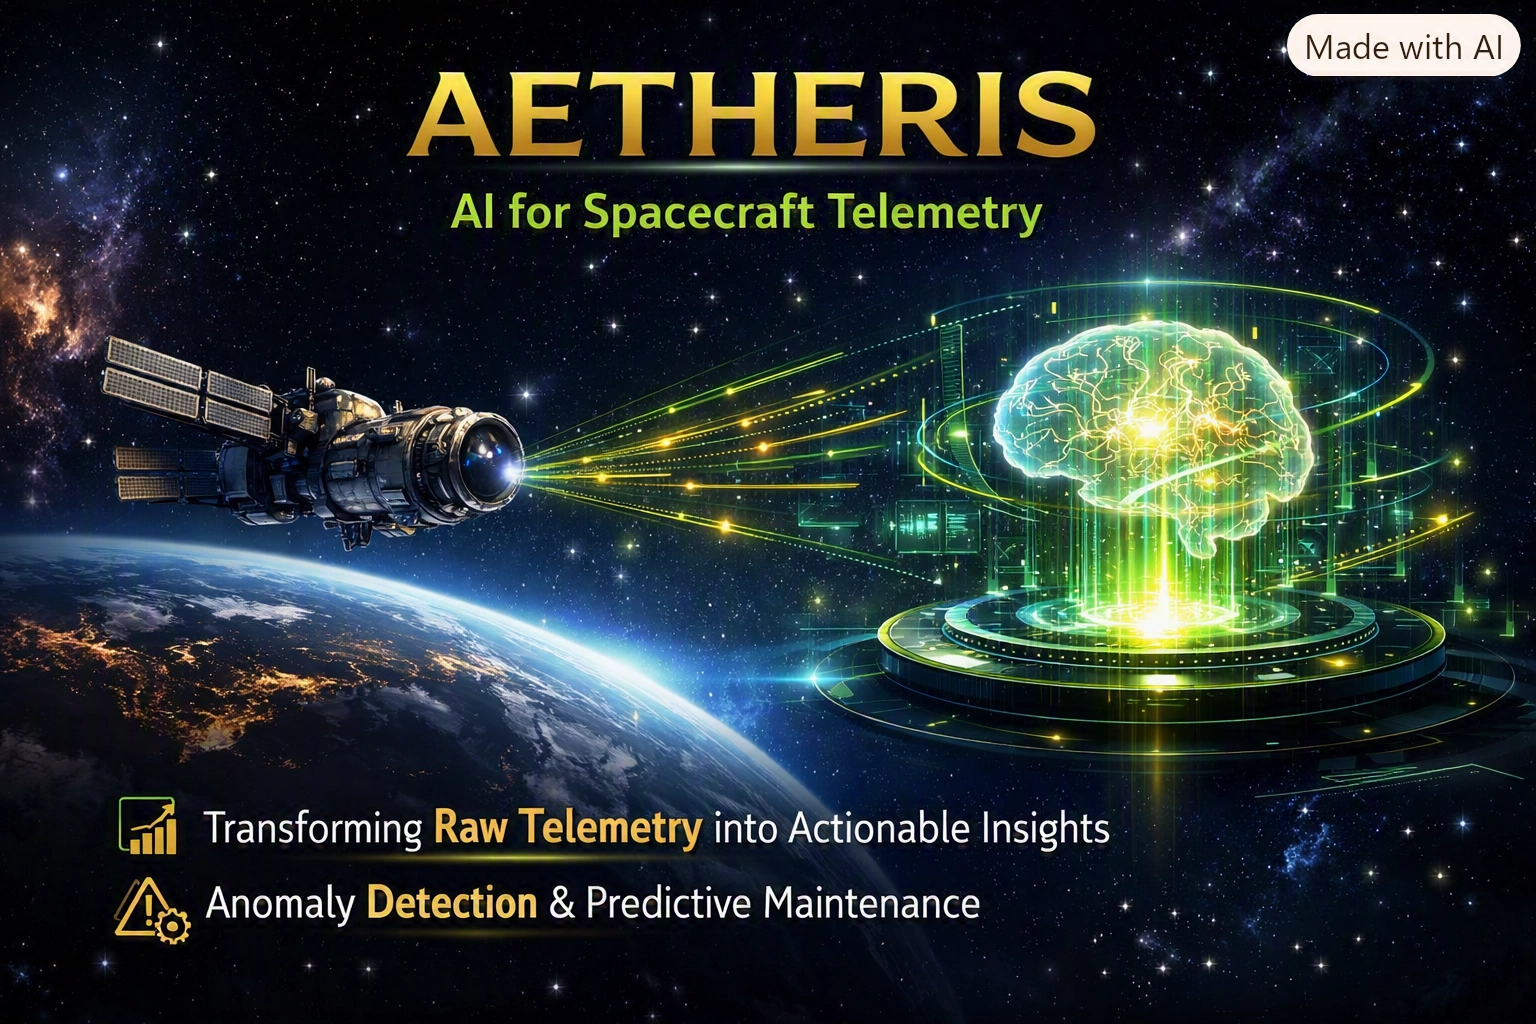
Aetheris
Aetheris is a Rust-based spacecraft telemetry anomaly-detection platform built to make changing sensor readings easier to inspect and interpret.
What I built
Core anomaly detection for battery-temperature telemetry
A replay CLI that produces readable anomaly output and structured JSON
A structured HTTP API for detection responses
A live dashboard served by the API, using Server-Sent Events to update telemetry readings every 3 seconds
Unit and integration test coverage for the detector and public API
Product experience
The dashboard cycles through normal, high, and critical telemetry events, updating the sensor, value, severity, explanation, and sparkline views in real time. This gives users a compact way to monitor shifting telemetry conditions without refreshing the page.
Technical approach
The project is split into a Rust core for telemetry models and detection logic, an Axum API for structured endpoints and dashboard delivery, and a browser dashboard for live visualization. Docker Compose is included for local setup.
Current scope
Aetheris currently focuses on detector logic, replay analysis, a structured API, and live telemetry visualization. Future ideas such as AI-generated explanations, predictive maintenance, and multi-satellite views are documented as planned work, not part of the current build.
Like this project
Posted Aug 24, 2026
Rust spacecraft telemetry anomaly detection with a live SSE dashboard.