Data:re - Performance dashboard for insurance agents
Mariusz Ciesla
Performance dashboard for insurance agents
Insurance agents lack tools that turn customer data into actionable insight.
The dashboard solves that gap with a composable interface agents configure to track what matters — conversion rates, client segments, policy performance —without wrestling with rigid reports or disconnected systems.
Built from direct collaboration with agents during discovery sessions, the product focused on the metrics that actually drive the business forward.
My work included:
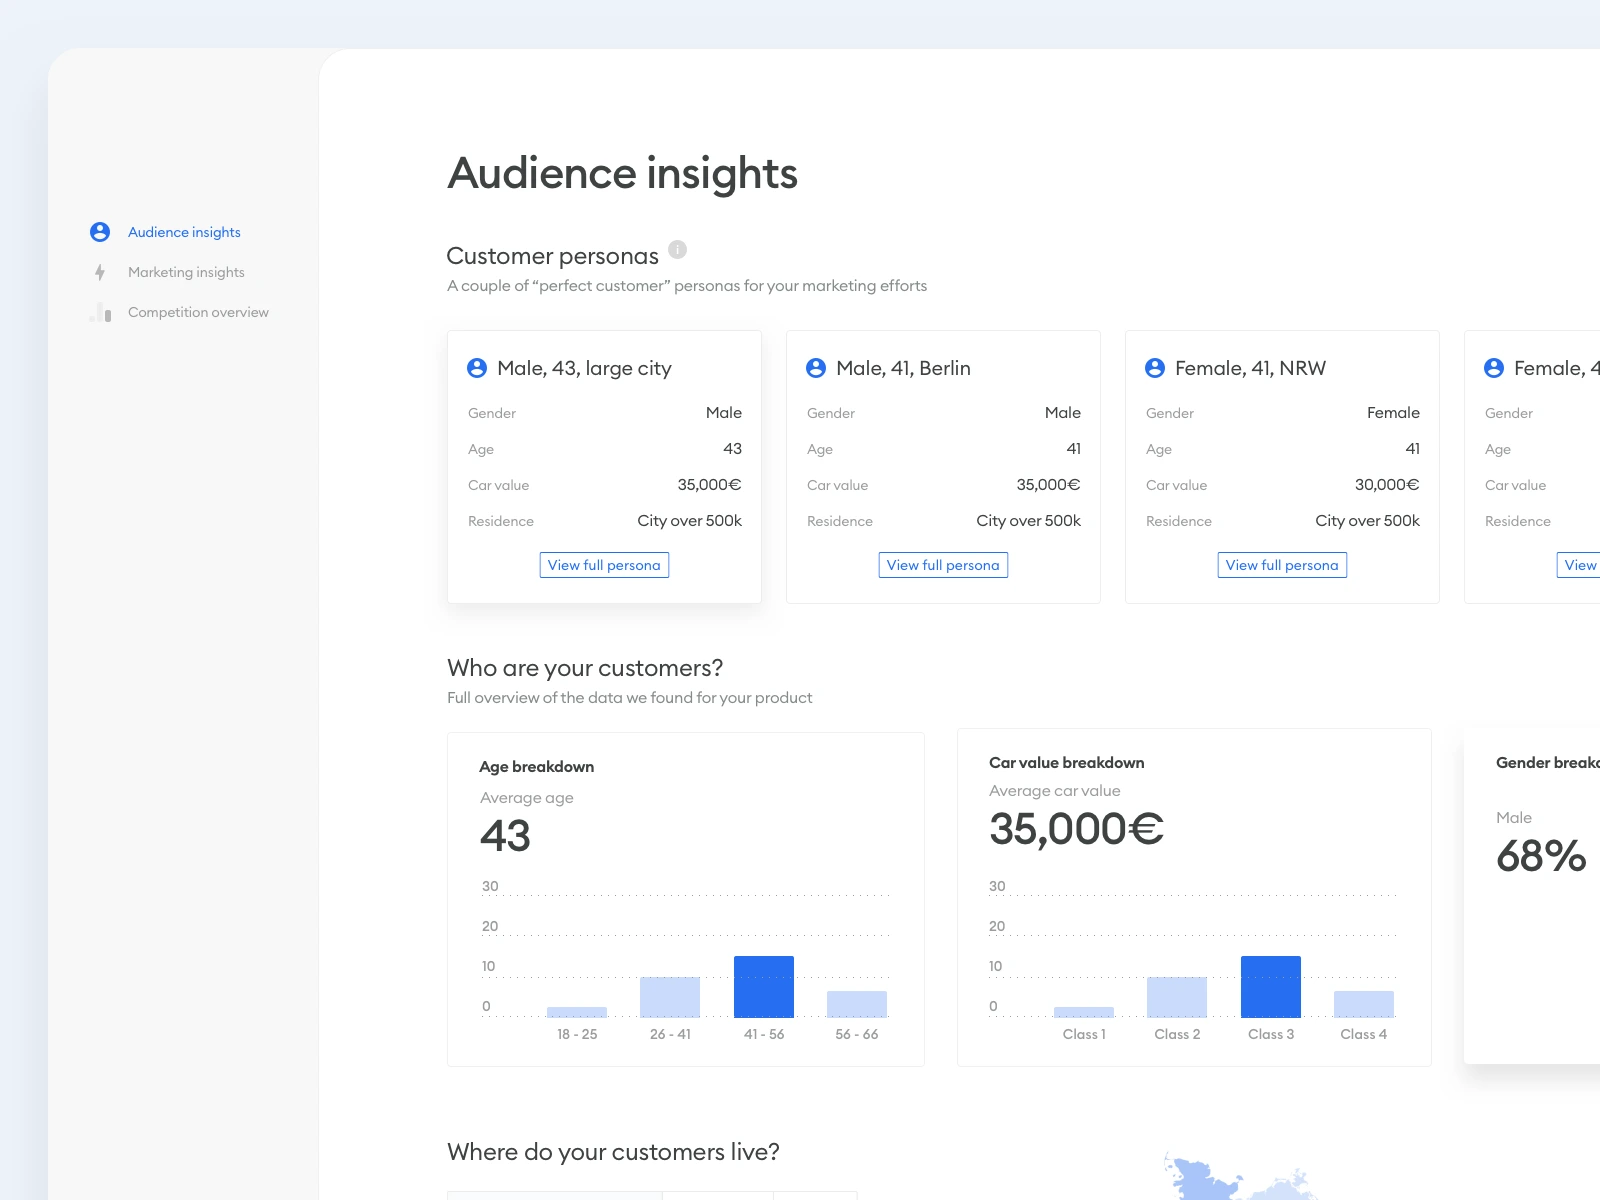
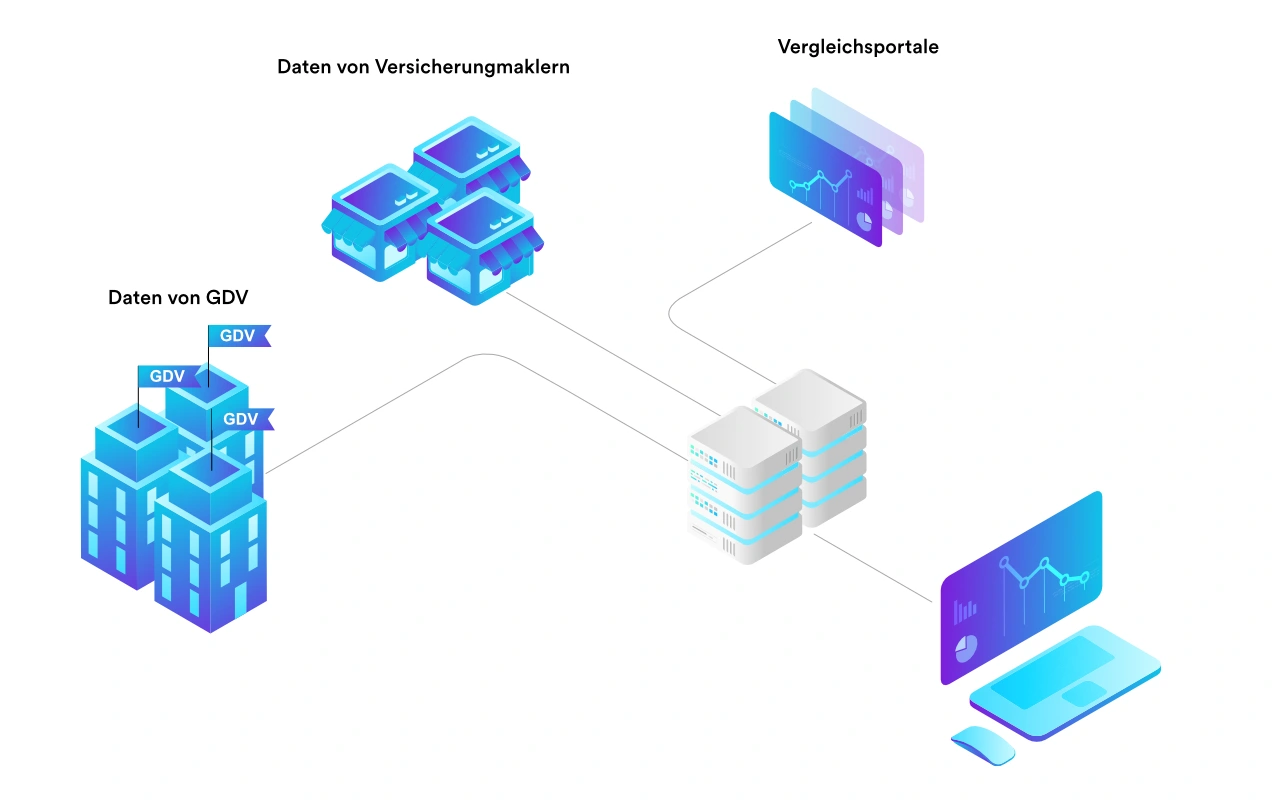
multiple initial dashboards (audience analytics, sales analytics) surfaced high-potential client personas using market and comparison portal data, and used prediction models over online and offline activity to show what strategies convert.
purpose-built design system including custom data visualization components unified data visualization patterns with UI components, enabling rapid iteration on dashboard layouts while maintaining visual coherence across charts, tables, and filters.
aligned the product's visual identity with functional requirements — ensuring color semantics, typography scales, and interaction patterns served both readability and agent decision-making.
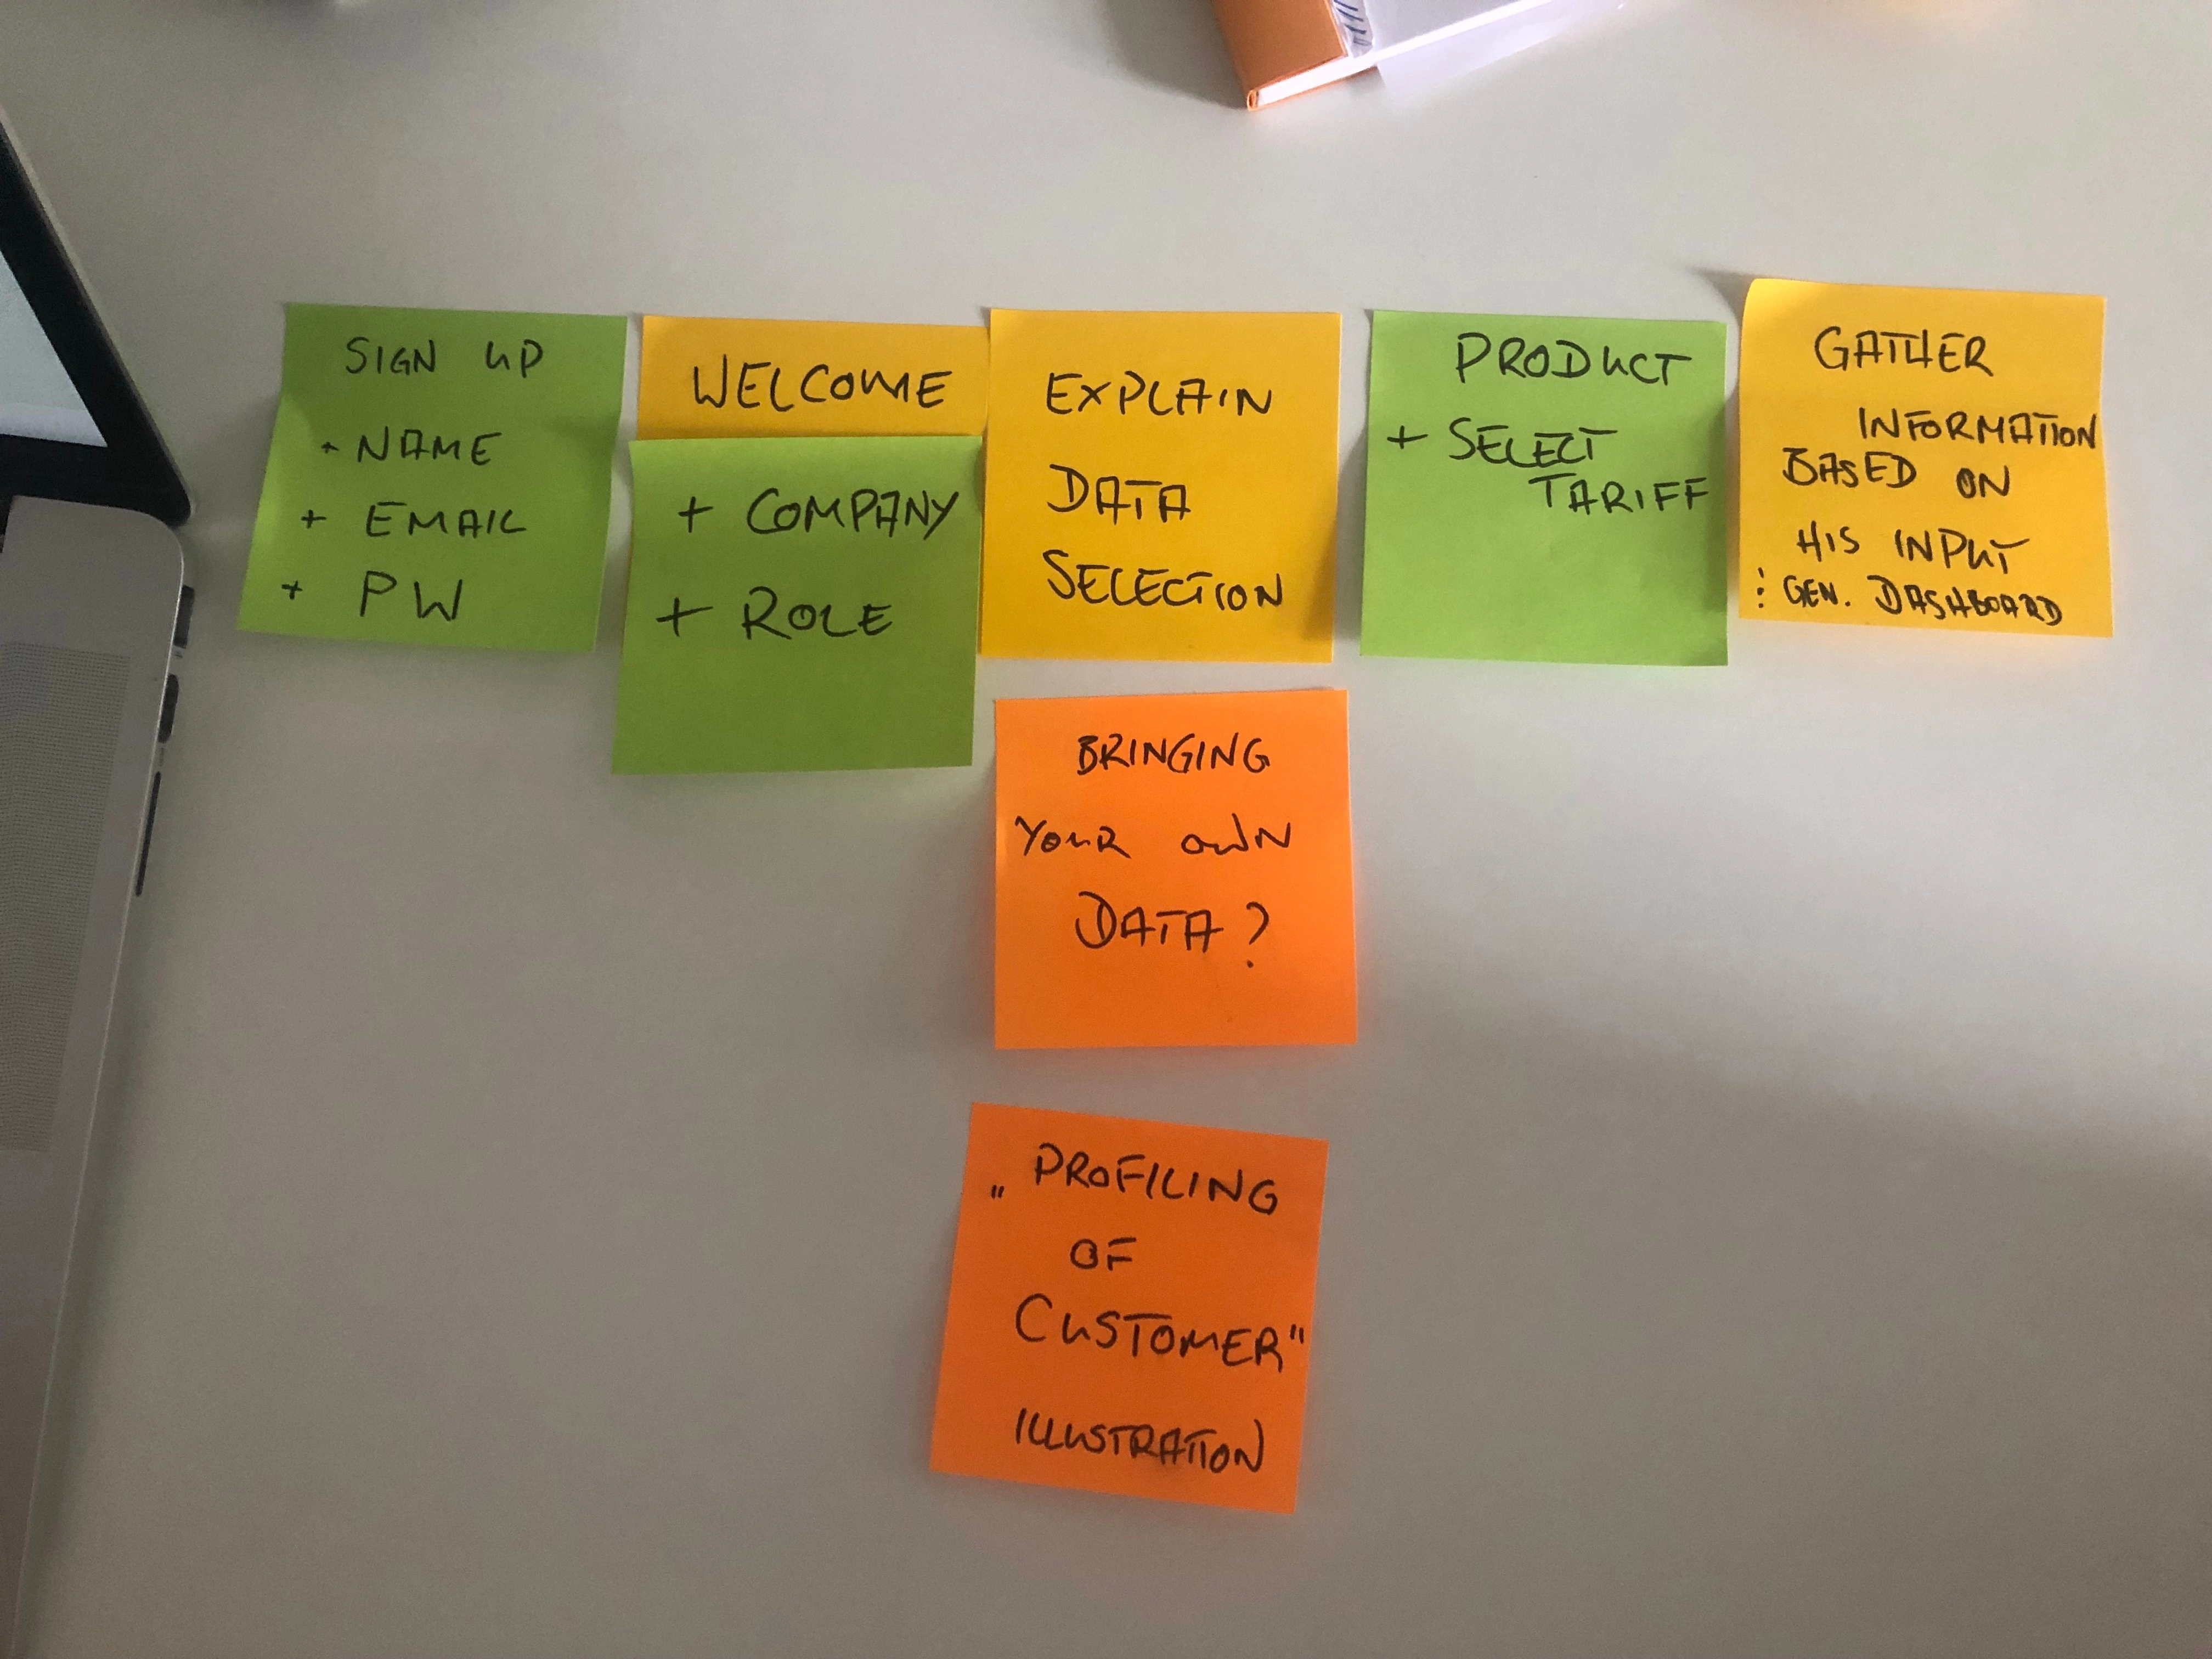
Thinking through the flows with the team
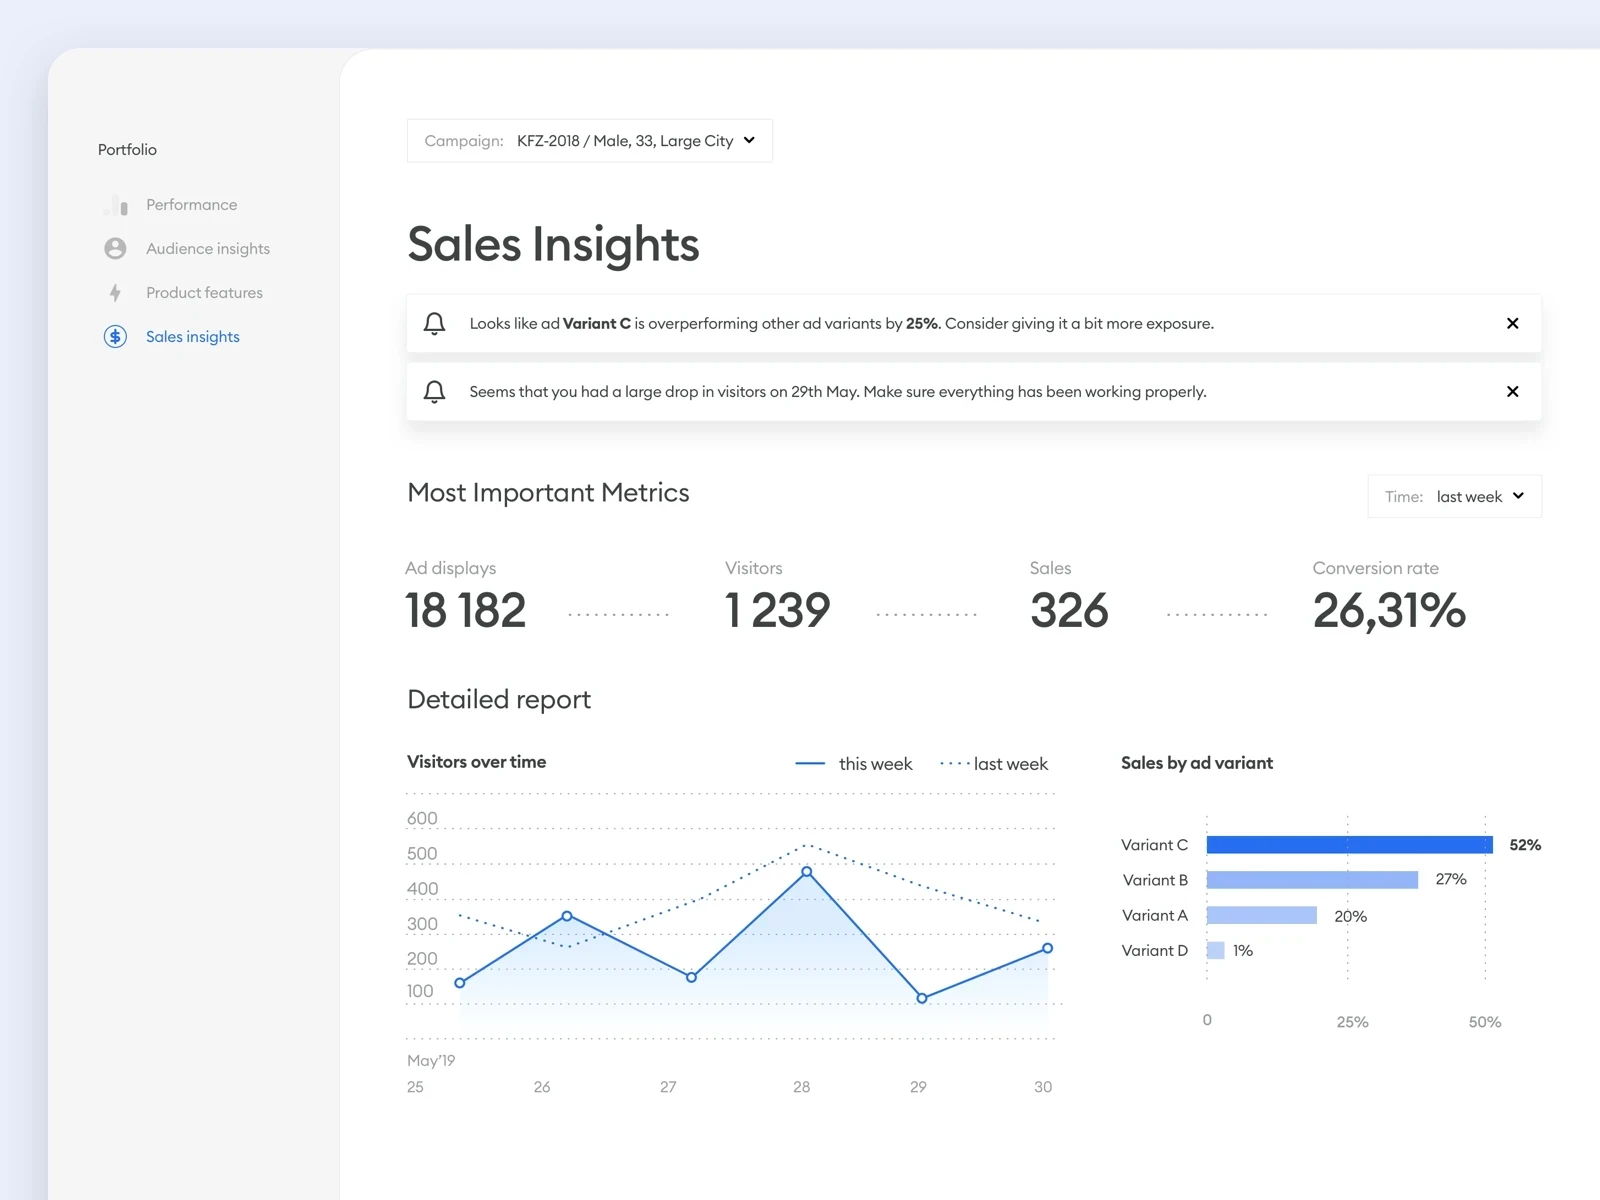
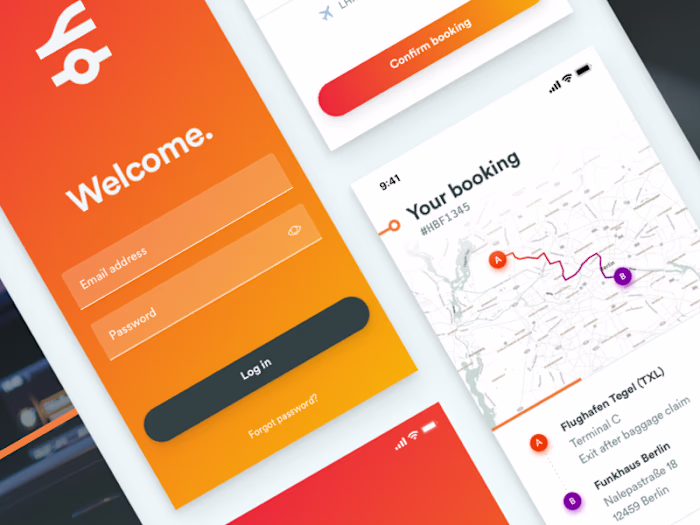
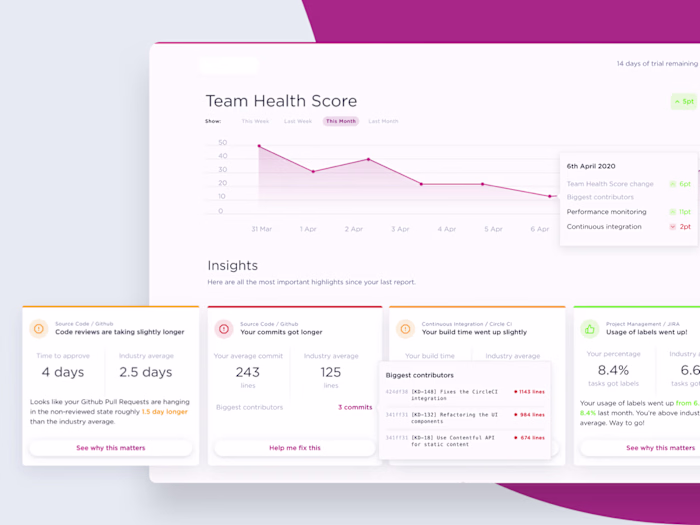
Sales insight dashboard design allowing the user to look into their day to day operations.
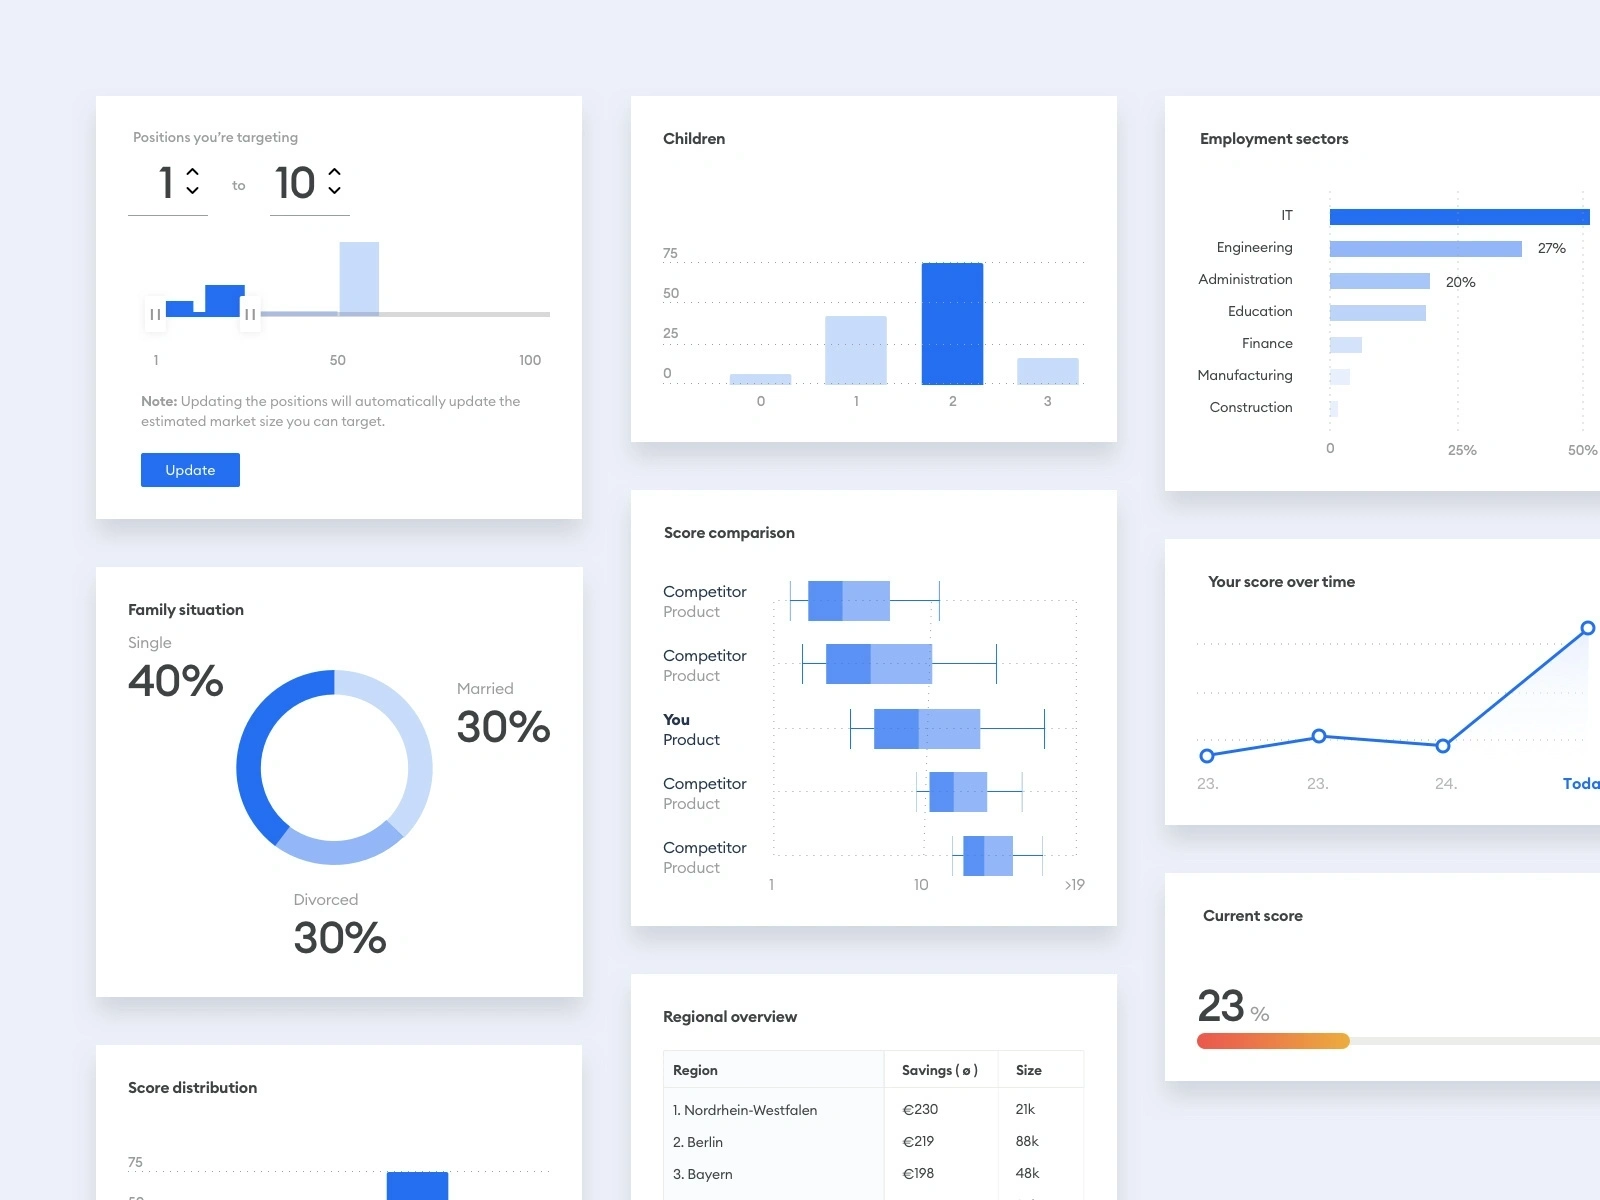
Modular design system allowing for different types of data visualization and components that could be mixed and matched.
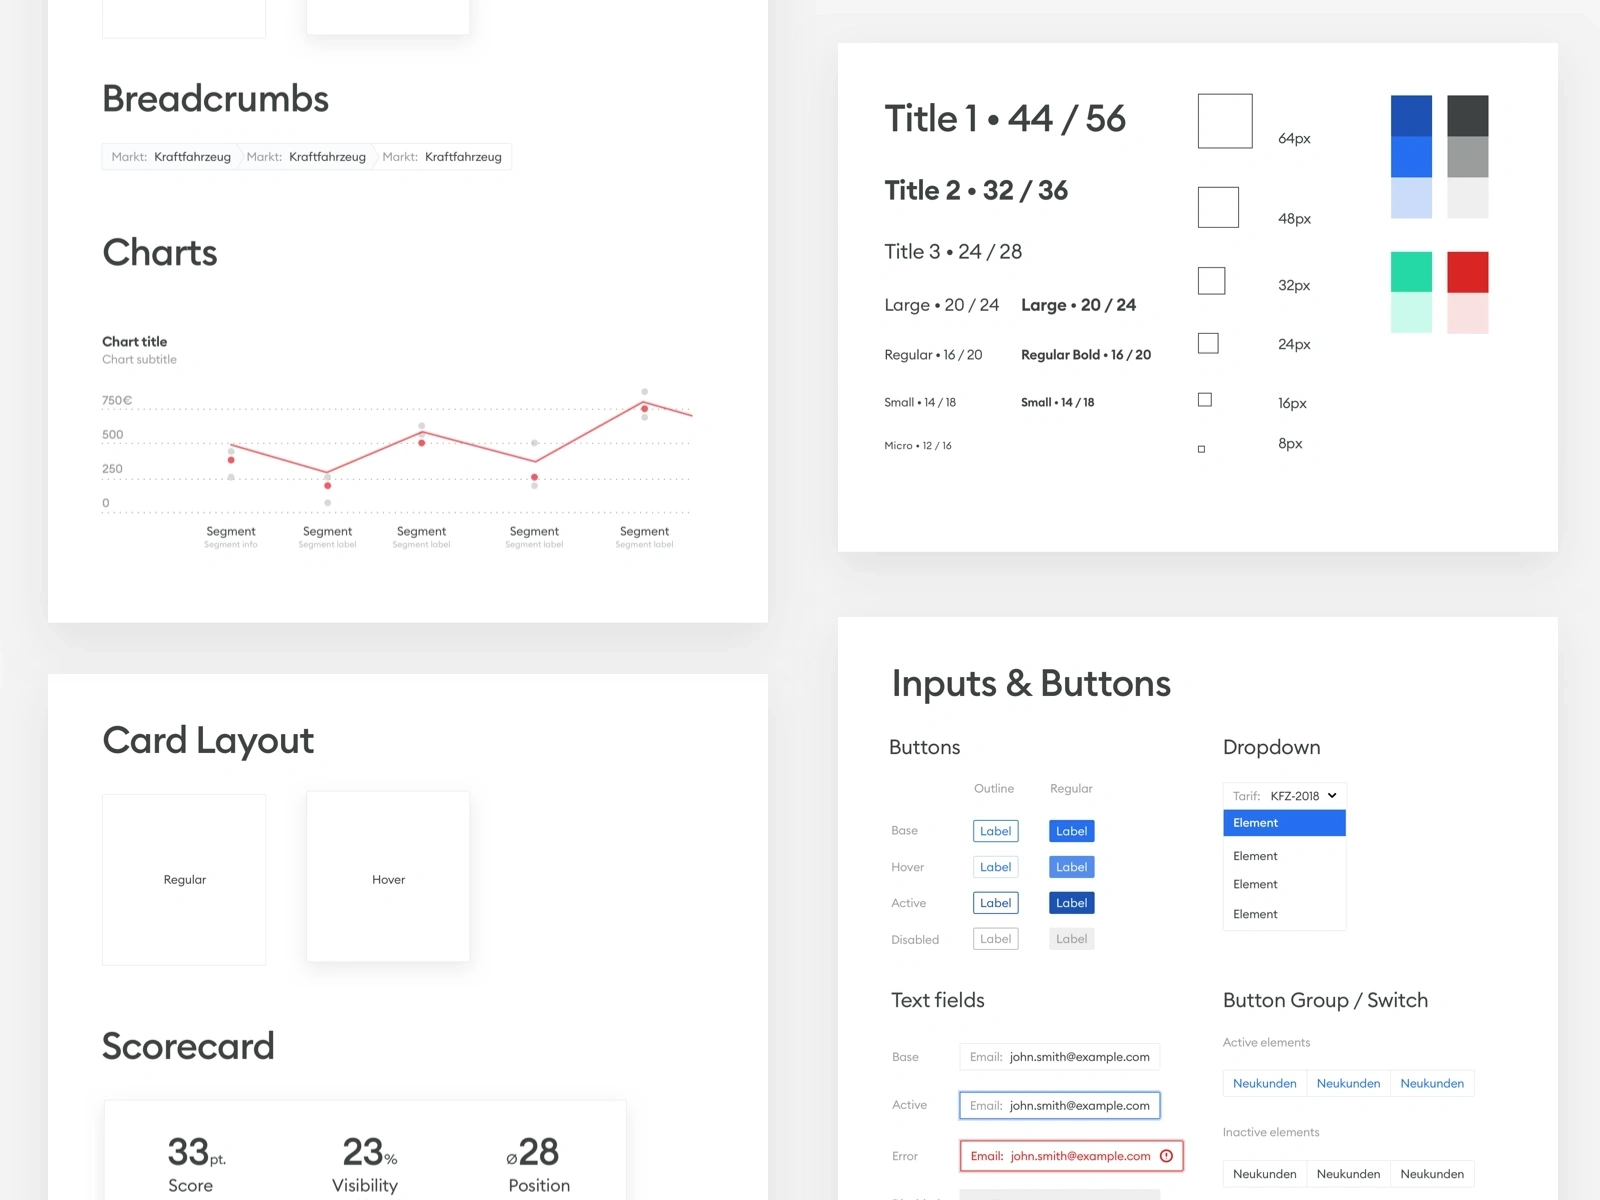
Initial style guide for user interface
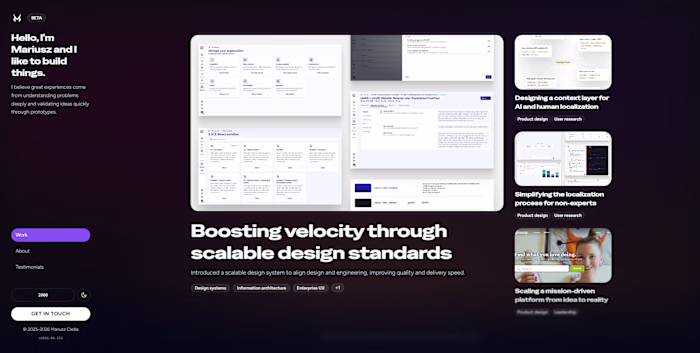
Exploring illustration style that could be used in marketing and product visual identity system
Like this project
Posted Feb 2, 2026
Built out the initial design system and user experience for an early stage Berlin-based insurtech startup, creating an environment for rapid UI iteration.