Exploratory Data Analysis on Shop Sales Data
Syed Ashar
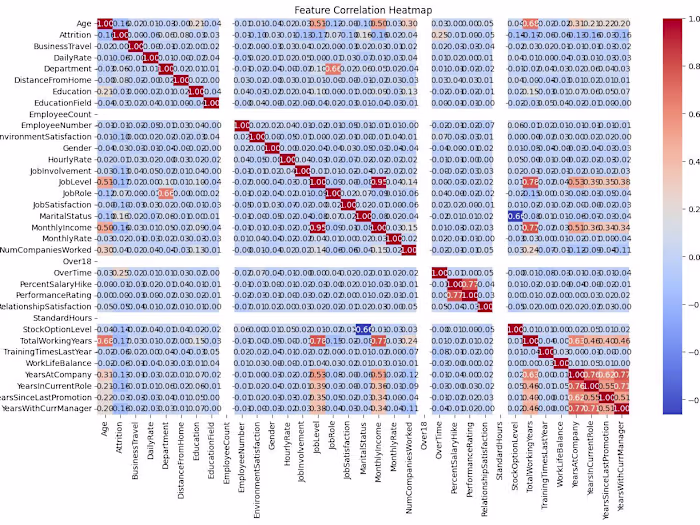
🚀 Exploratory Data Analysis (EDA) on Shop Sales Data 📊 I recently worked on an Exploratory Data Analysis (EDA) project to uncover key insights from a shop's sales dataset. Using Python, Pandas, Matplotlib, and Seaborn, I analyzed sales trends, seasonal variations, regional performance, and product demand. 🔍 Key Findings: ✅ Sales Distribution: Right-skewed, with most transactions in the lower range. ✅ Seasonal Trends: Sales peak during holiday seasons. ✅ Product Performance: Top 5 products contribute significantly to revenue. ✅ Regional Analysis: High revenue potential in New York & LA. 🛠 Technologies Used: 📌 Python | Pandas | Matplotlib | Seaborn | Jupyter Notebook This analysis helps businesses make data-driven decisions and optimize sales strategies. Check out my GitHub repo for details : https://lnkd.in/dx_bpHbh #EDA #DataScience #SalesAnalysis #Python #DataAnalytics #BusinessIntelligence
Like this project
Posted Aug 6, 2025
Conducted EDA on shop sales data using Python and visualization tools.
Likes
0
Views
1