Irregular Time Series Alignment and Gap Filling with Python
Dani Dobre
Introduction
Imagine a scenario involving a remote device transmitting data over a network while also saving data on an SD card as a backup. The challenge at hand is to combine these two separate data series into a unified one to address gaps within one of the series. These series don't align perfectly due to variations in data collection methods, leading to inconsistencies.
Glossary:
DB - refers to the data server that collects data over the network
Sensor - refers to the device that sends data over the network
Time drifting - the phenomenon where timestamps associated with data points gradually deviate from their expected progression due to inconsistencies or inaccuracies in timekeeping mechanisms
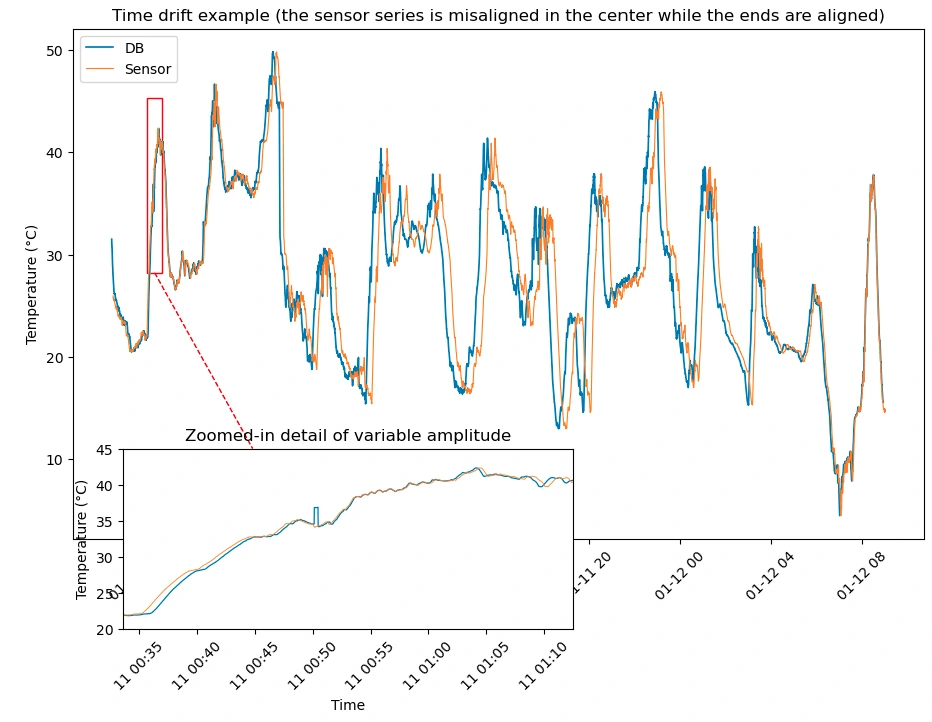
Variable amplitude - refers to the micro-level variability of actual values stored in the DB and Sensor series
Challenges:
The "DB" data series is gathered through Wi-Fi and timestamped at the time of reception, contributing to variable amplitude.
The "Sensor" data series is saved locally on the monitored device, with timestamps influenced by time-drifting caused by external factors.
The "DB" data series includes gaps due to Wi-Fi connection interruptions.
Both data series may exhibit slightly varying amplitude at any given time.
Objective:
The goal is to develop a method that can automatically align data series and populate missing values in the "DB" series with corresponding "Sensor" values.
Examples
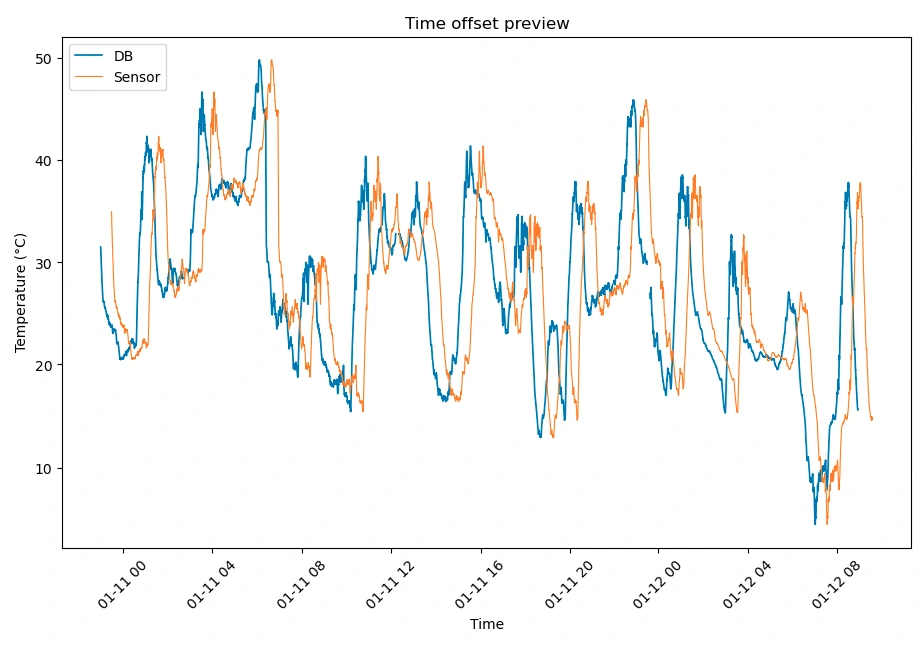
An exaggerated time drift is depicted in the plot below. It is evident that while the two series align closely towards their ends, they diverge significantly in the middle.
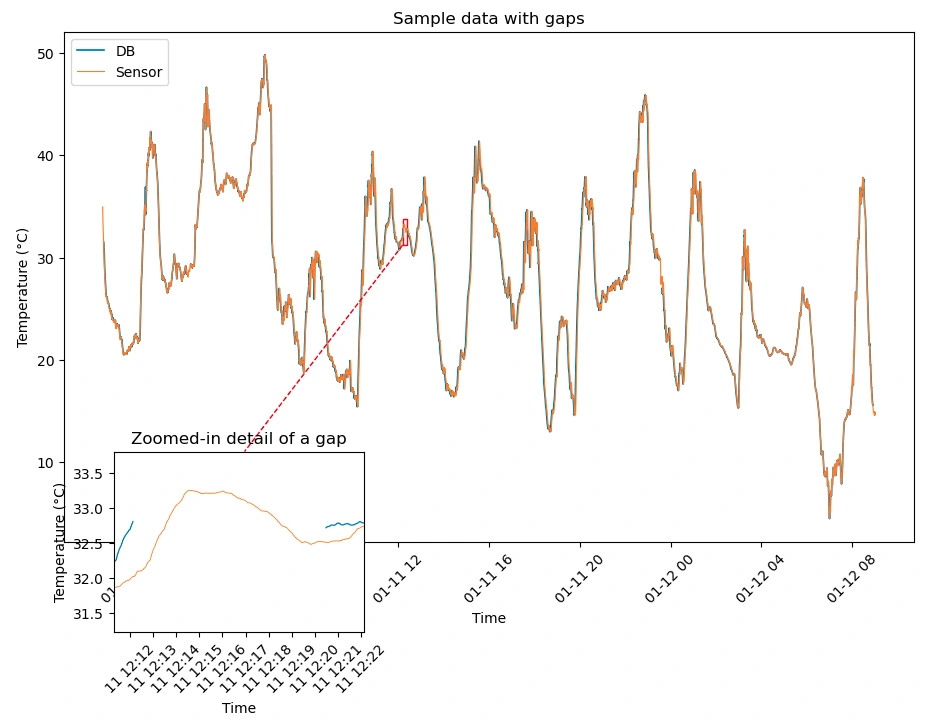
Detailed view of a gap in the DB series
An obvious offset to one series is applied to emphasize that the alignment of the two series is not a prerequisite for the algorithm to function correctly
Series alignment
Given the varying amplitude of the values (approximately spanning orders of magnitude of 10^-2), potential time drift, and the anticipated size of datasets exceeding a million rows, our approach utilizes polynomial regression for rapid coarse alignment. This technique effectively reduces the number of data points to be compared, streamlining the process to the number of roots found in the first derivative.
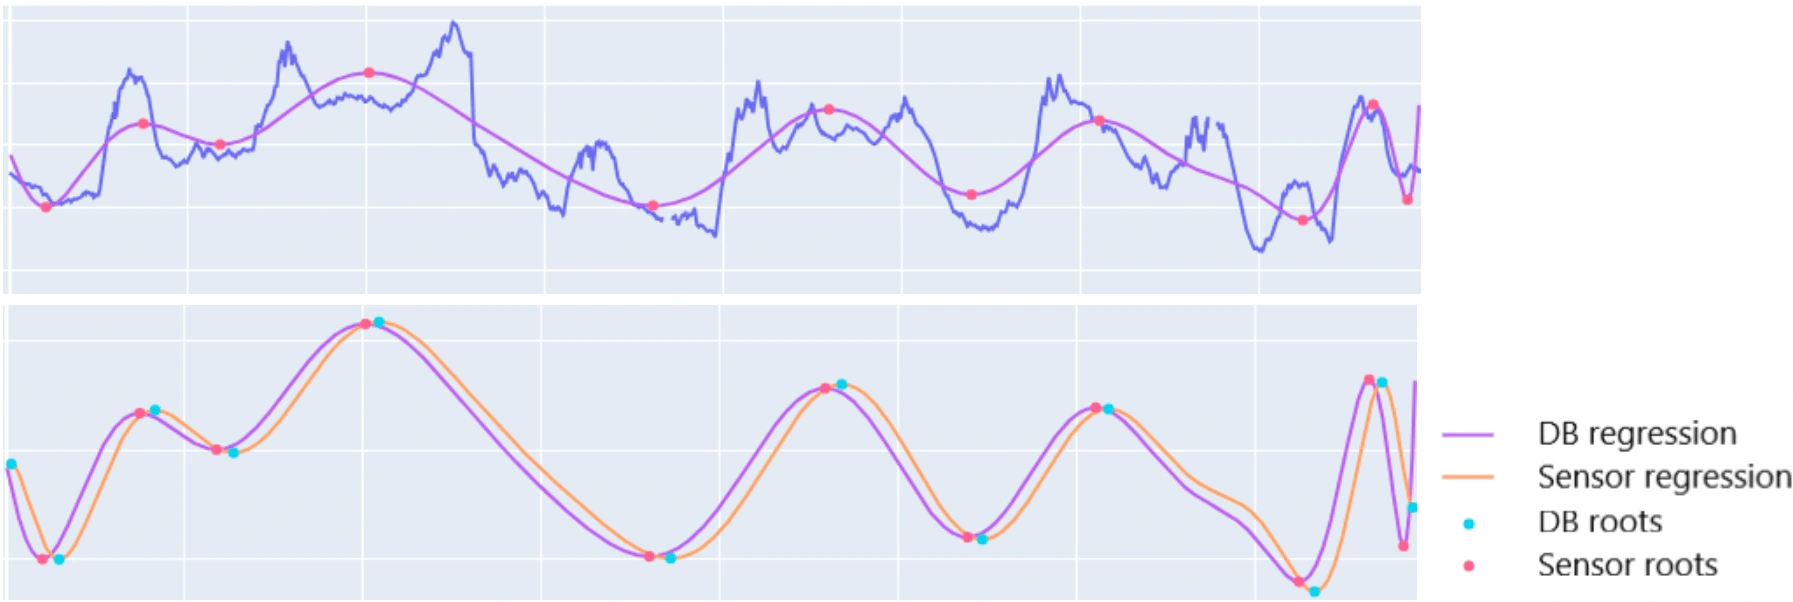
The pairs of roots clearly show that the Sensor series has to be shifted to the right
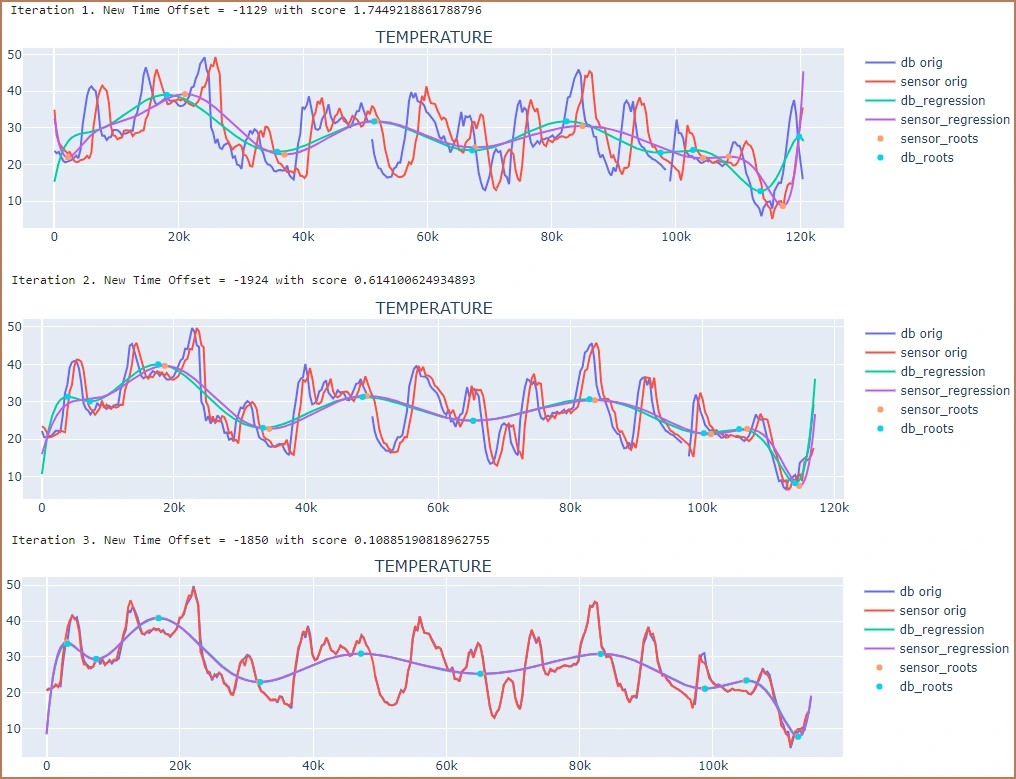
Ouptut of a test run
Results
The visualizations presented in the form of plots clearly illustrate the gaps in one series and the replacement data derived from the second series, showcasing the effectiveness of the alignment process.
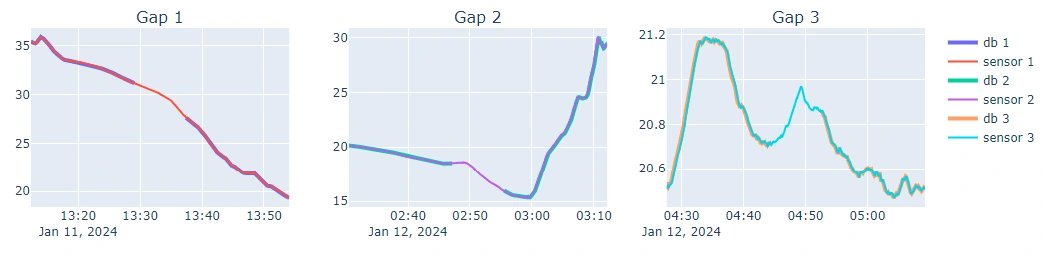
The coarse line db plots highlights the perfect alignment over the gaps of the thin line sensor plots
The Jupyter Notebook in the gist illustrates the functionality described above with random gaps at each run, adjustable initial offset and sample data to play with.
Like this project
Posted May 2, 2024
Develop a method that can automatically align irregular time series and populate missing values in one series with corresponding values from another.