Titanic Survival Prediction - Streamlit App
Neeraj Jaiswal
🚢 Titanic Survival Prediction - Streamlit App
A comprehensive machine learning web application for predicting Titanic passenger survival using advanced data analysis and multiple ML algorithms.
🔗 Streamlit App Link - https://titanic-survival-prediction-webapp.streamlit.app/
✨ Features
📊 Interactive Data Upload: Upload your own CSV datasets
🔍 Advanced Data Analysis: Automatic outlier detection and handling
🛠️ Data Preprocessing: Feature engineering and data cleaning
🤖 Multiple ML Models: Train and compare 10 different algorithms
📈 Rich Visualizations: Interactive charts and performance metrics
🔮 Bulk Predictions: Generate survival predictions for entire datasets
📥 Export Results: Download predictions as CSV files
🚀 Quick Start
Prerequisites
Python 3.8 or higher
pip package manager
Installation
Clone or download this repository
Install dependencies:
Run the Streamlit app:
Open your browser and navigate to
http://localhost:8501📋 Complete Step-by-Step Guide
🎯 Phase 1: Model Training (Using Training Data)
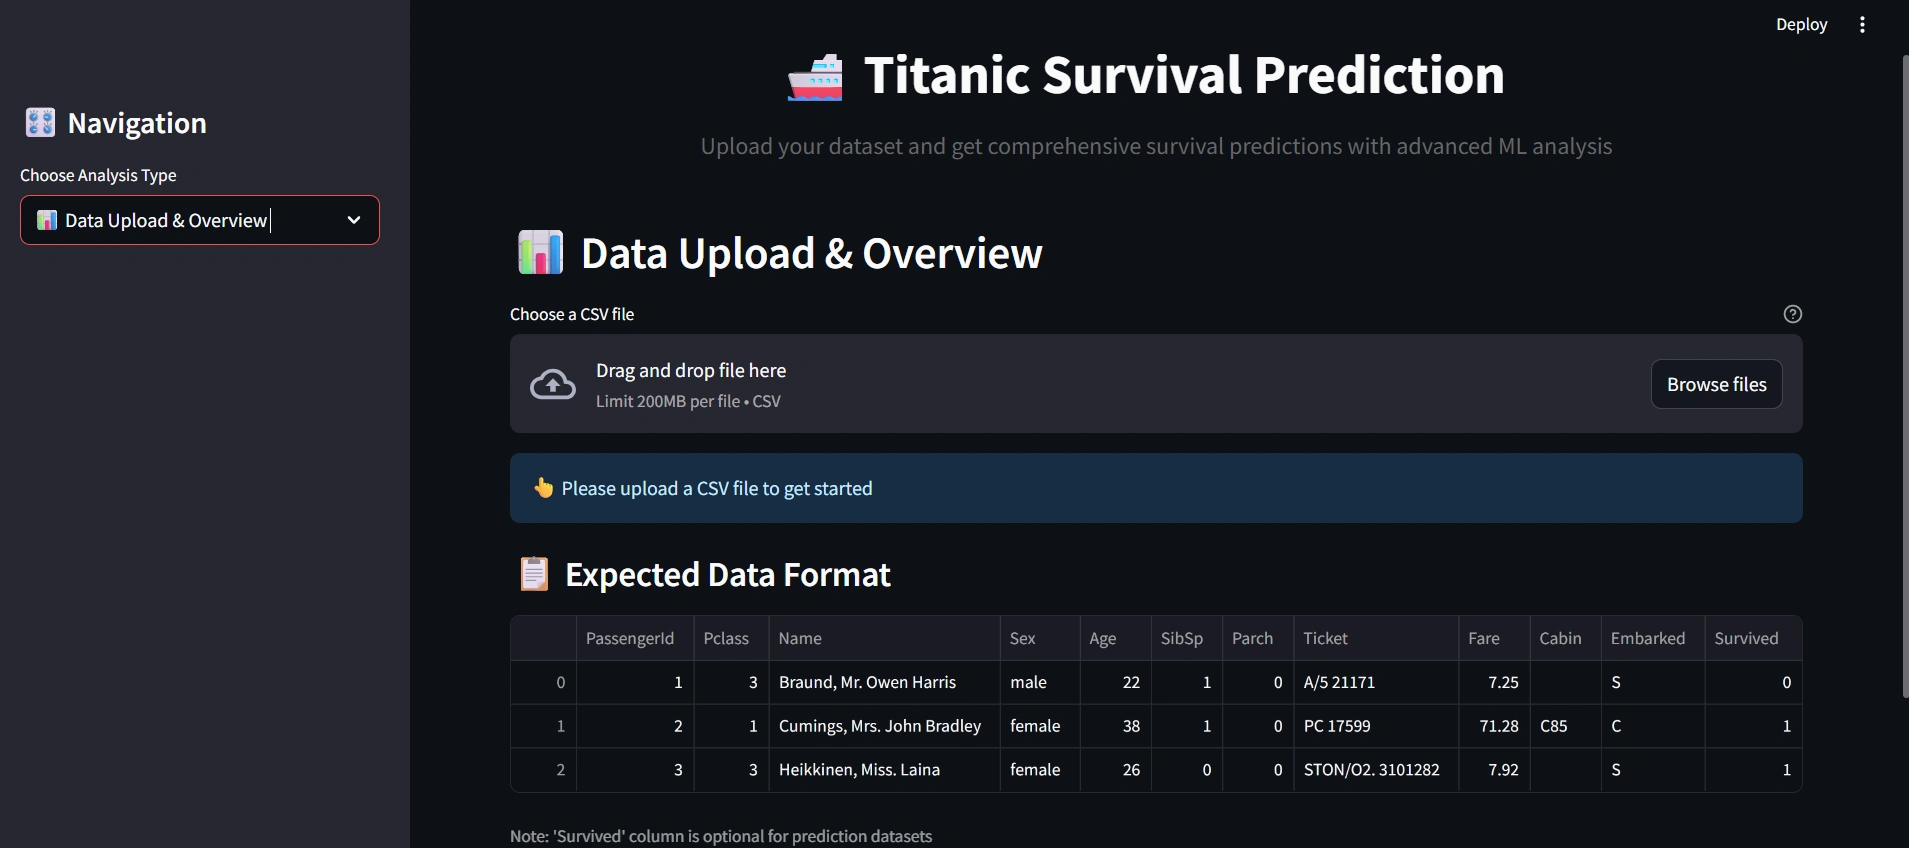
Step 1: Upload Training Data
Navigate to "📊 Data Upload & Overview" tab
Click "Browse files" button
Go to
Input/For training/ folderSelect and upload
train.csv fileReview the data overview, statistics, and column information
Step 2: Data Analysis & Preprocessing
Navigate to "🔍 Data Analysis" tab
Review the Outlier Detection & Handling section
Choose your preferred outlier handling method:
Cap: Replace outliers with boundary values (recommended)
Remove: Delete outlier rows
Transform: Apply log transformation
Click "🔧 Process Data" button
Review the processing results and new features created
Step 3: Explore Data Visualizations
View survival distribution charts
Analyze survival rates by passenger class
Examine age and fare distributions
Step 4: Train Machine Learning Models
Navigate to "🤖 Model Training" tab
Configure training parameters:
Test Set Size: 0.2 (20% for testing)
Cross-Validation Folds: 5 (recommended)
Click "🚀 Train Models" button
Wait for all 10 models to complete training
Step 5: Review Model Performance
Examine the Model Performance Results table
Identify the best performing model (highest F1-Score)
Review performance comparison charts
Step 6: Analyze Best Model Details
View confusion matrix and ROC curve
Review classification report
Understand model strengths and weaknesses
🎯 Phase 2: Making Predictions (Using Test Data)
Step 7: Upload Test Data
Return to "📊 Data Upload & Overview" tab
Click "Browse files" button again
Go to
Input/For testing/ folderSelect and upload
test.csv fileReview the test data overview
Step 8: Process Test Data
Navigate to "🔍 Data Analysis" tab
Apply the same outlier handling method used for training
Click "🔧 Process Data" button
Ensure consistent preprocessing with training data
Step 9: Generate Predictions
Navigate to "📈 Predictions & Results" tab
The app will automatically use the best trained model
Click "🔮 Generate Predictions" button
Review prediction summary statistics
Step 10: Download and Analyze Results
Review the Prediction Results table
Click "📥 Download Predictions as CSV" to save results
Analyze prediction patterns and confidence levels
Explore survival rate visualizations by different factors
💡 Key Workflow Tips
✅ Best Practices
Always use the same outlier handling method for both training and test data
Process training data completely before uploading test data
Keep the app running throughout the entire workflow to maintain trained models
Download predictions immediately after generation to avoid losing results
⚠️ Important Notes
The trained models are stored in session state and will be lost if you refresh the page
Test data should have the same structure as training data (except for the 'Survived' column)
For best results, ensure your test data comes from the same distribution as training data
🤖 Supported Models
The application trains and compares 10 different machine learning algorithms:
Logistic Regression: Linear classification with regularization
Random Forest: Ensemble of decision trees with voting
Gradient Boosting: Sequential boosting algorithm
Support Vector Machine (SVM): Kernel-based classification
K-Nearest Neighbors: Instance-based learning
Naive Bayes: Probabilistic classifier
Decision Tree: Single tree-based classifier
AdaBoost: Adaptive boosting ensemble
Extra Trees: Extremely randomized trees
XGBoost: Extreme gradient boosting (often best performer)
📊 Data Format Requirements
📁 Folder Structure
📋 Required Columns
Your CSV files should contain passenger information with these columns:
Training Data (train.csv)
PassengerId: Unique identifier (integer)Pclass: Passenger class (1=First, 2=Second, 3=Third)Name: Passenger name (string)Sex: Gender (male/female)Age: Age in years (numeric, can have missing values)SibSp: Number of siblings/spouses aboard (integer)Parch: Number of parents/children aboard (integer)Ticket: Ticket number (string)Fare: Passenger fare (numeric, can have missing values)Cabin: Cabin number (string, can be empty)Embarked: Port of embarkation (C=Cherbourg, Q=Queenstown, S=Southampton)Survived: Survival status (0=Died, 1=Survived) - Required for trainingTest Data (test.csv)
Same columns as training data except
Survived columnUsed for generating predictions after model training
🎯 Key Features
Automatic Feature Engineering
FamilySize: Total family members aboard
IsAlone: Binary indicator for solo travelers
Title: Extracted from passenger names
AgeGroup: Age categories (Child, Teen, Young Adult, Adult, Senior)
FareGroup: Fare quartiles (Low, Medium, High, Very High)
FamilySizeGroup: Family size categories
Advanced Data Processing
Outlier Detection: IQR-based outlier identification
Missing Value Handling: Intelligent imputation strategies
Data Scaling: Standardization for numerical features
Encoding: One-hot encoding for categorical variables
Performance Metrics
Accuracy, Precision, Recall, F1-Score
ROC-AUC scores
Cross-validation results
Confusion matrices
ROC curves
🛠️ Technical Details
Framework: Streamlit for web interface
ML Library: Scikit-learn with XGBoost
Visualization: Plotly for interactive charts
Data Processing: Pandas and NumPy
Styling: Custom CSS for enhanced UI
📁 Project Structure
🔧 Troubleshooting
Common Issues & Solutions
1. "Please upload data first" Warning
Solution: Make sure you've uploaded a CSV file in the "Data Upload & Overview" tab first
2. "Please process your data first" Warning
Solution: Complete the data preprocessing in the "Data Analysis" tab before training models
3. Models not training
Check: Ensure your training data has a 'Survived' column
Check: Verify data has been processed successfully
Solution: Try refreshing the page and starting over
4. Predictions not generating
Check: Ensure models have been trained first
Check: Verify test data has been processed
Solution: Make sure you're using the same outlier handling method for both training and test data
5. Download not working
Solution: Ensure predictions have been generated successfully
Try: Right-click the download button and "Save link as..."
Performance Tips
Large datasets: Consider using smaller test sizes (10-15%) for faster training
Memory issues: Close other applications while training models
Slow performance: Try using fewer cross-validation folds (3 instead of 5)
🤝 Contributing
Feel free to fork this project and submit pull requests for improvements! Areas for enhancement:
Additional machine learning algorithms
More advanced feature engineering
Enhanced visualizations
Model persistence and loading
Batch processing capabilities
📄 License
This project is open source and available under the MIT License.
Happy Predicting! 🚢✨
Like this project
Posted Jul 6, 2025
Created a Streamlit app for Titanic survival prediction using ML algorithms.
Likes
0
Views
6
Timeline
Jul 1, 2025 - Jul 6, 2025
Clients
Celebal Technologies