Sovrun Treasury Report (Web Development + 3D)
Nardo Marquez
Sovrun Treasury Report: A Modern Financial Dashboard
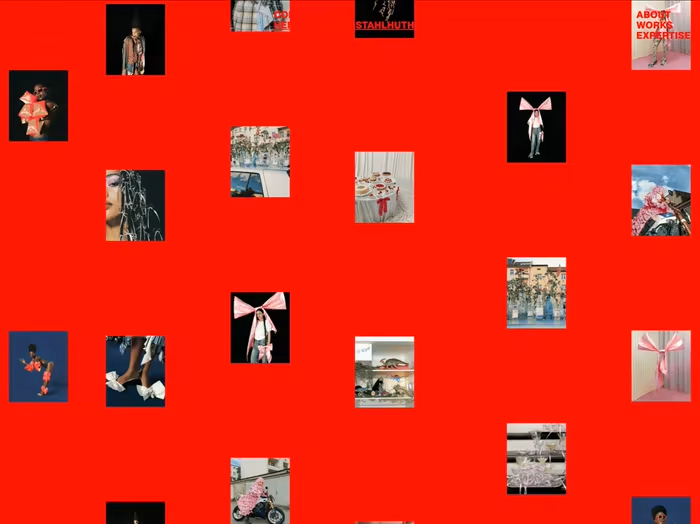
Sovrun Treasury Report website showcase
The Challenge
Sovrun needed a way to present complex financial data in an engaging, easy-to-understand format. Traditional spreadsheets and static reports weren't cutting it. They needed something that would make their treasury data come alive while maintaining the sophistication expected in financial reporting.
The Solution
I built an interactive dashboard that makes financial data actually interesting to look at. Using Next.js and Three.js, I created an experience that's both beautiful and functional. The platform updates in real-time and looks great on any device, from phones to desktop monitors.
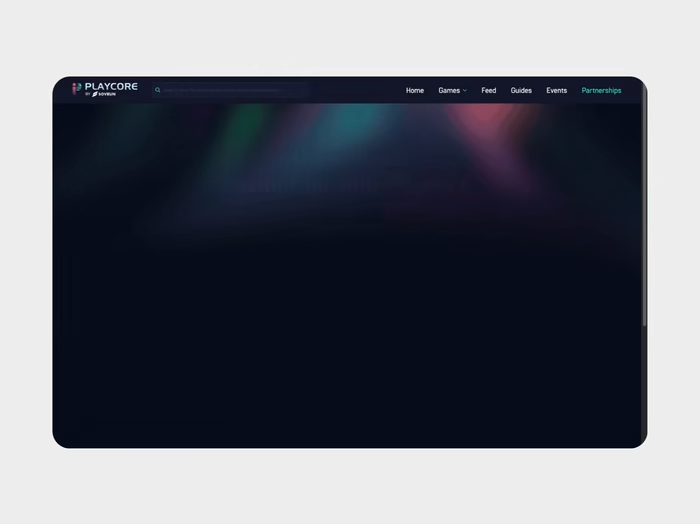
Sovrun Treasury Report's hero section with 3D elements
The dashboard comes alive with subtle animations and 3D elements that make exploring financial data feel natural. It's like using a premium streaming service, but for financial reporting - smooth, responsive, and actually enjoyable to use.
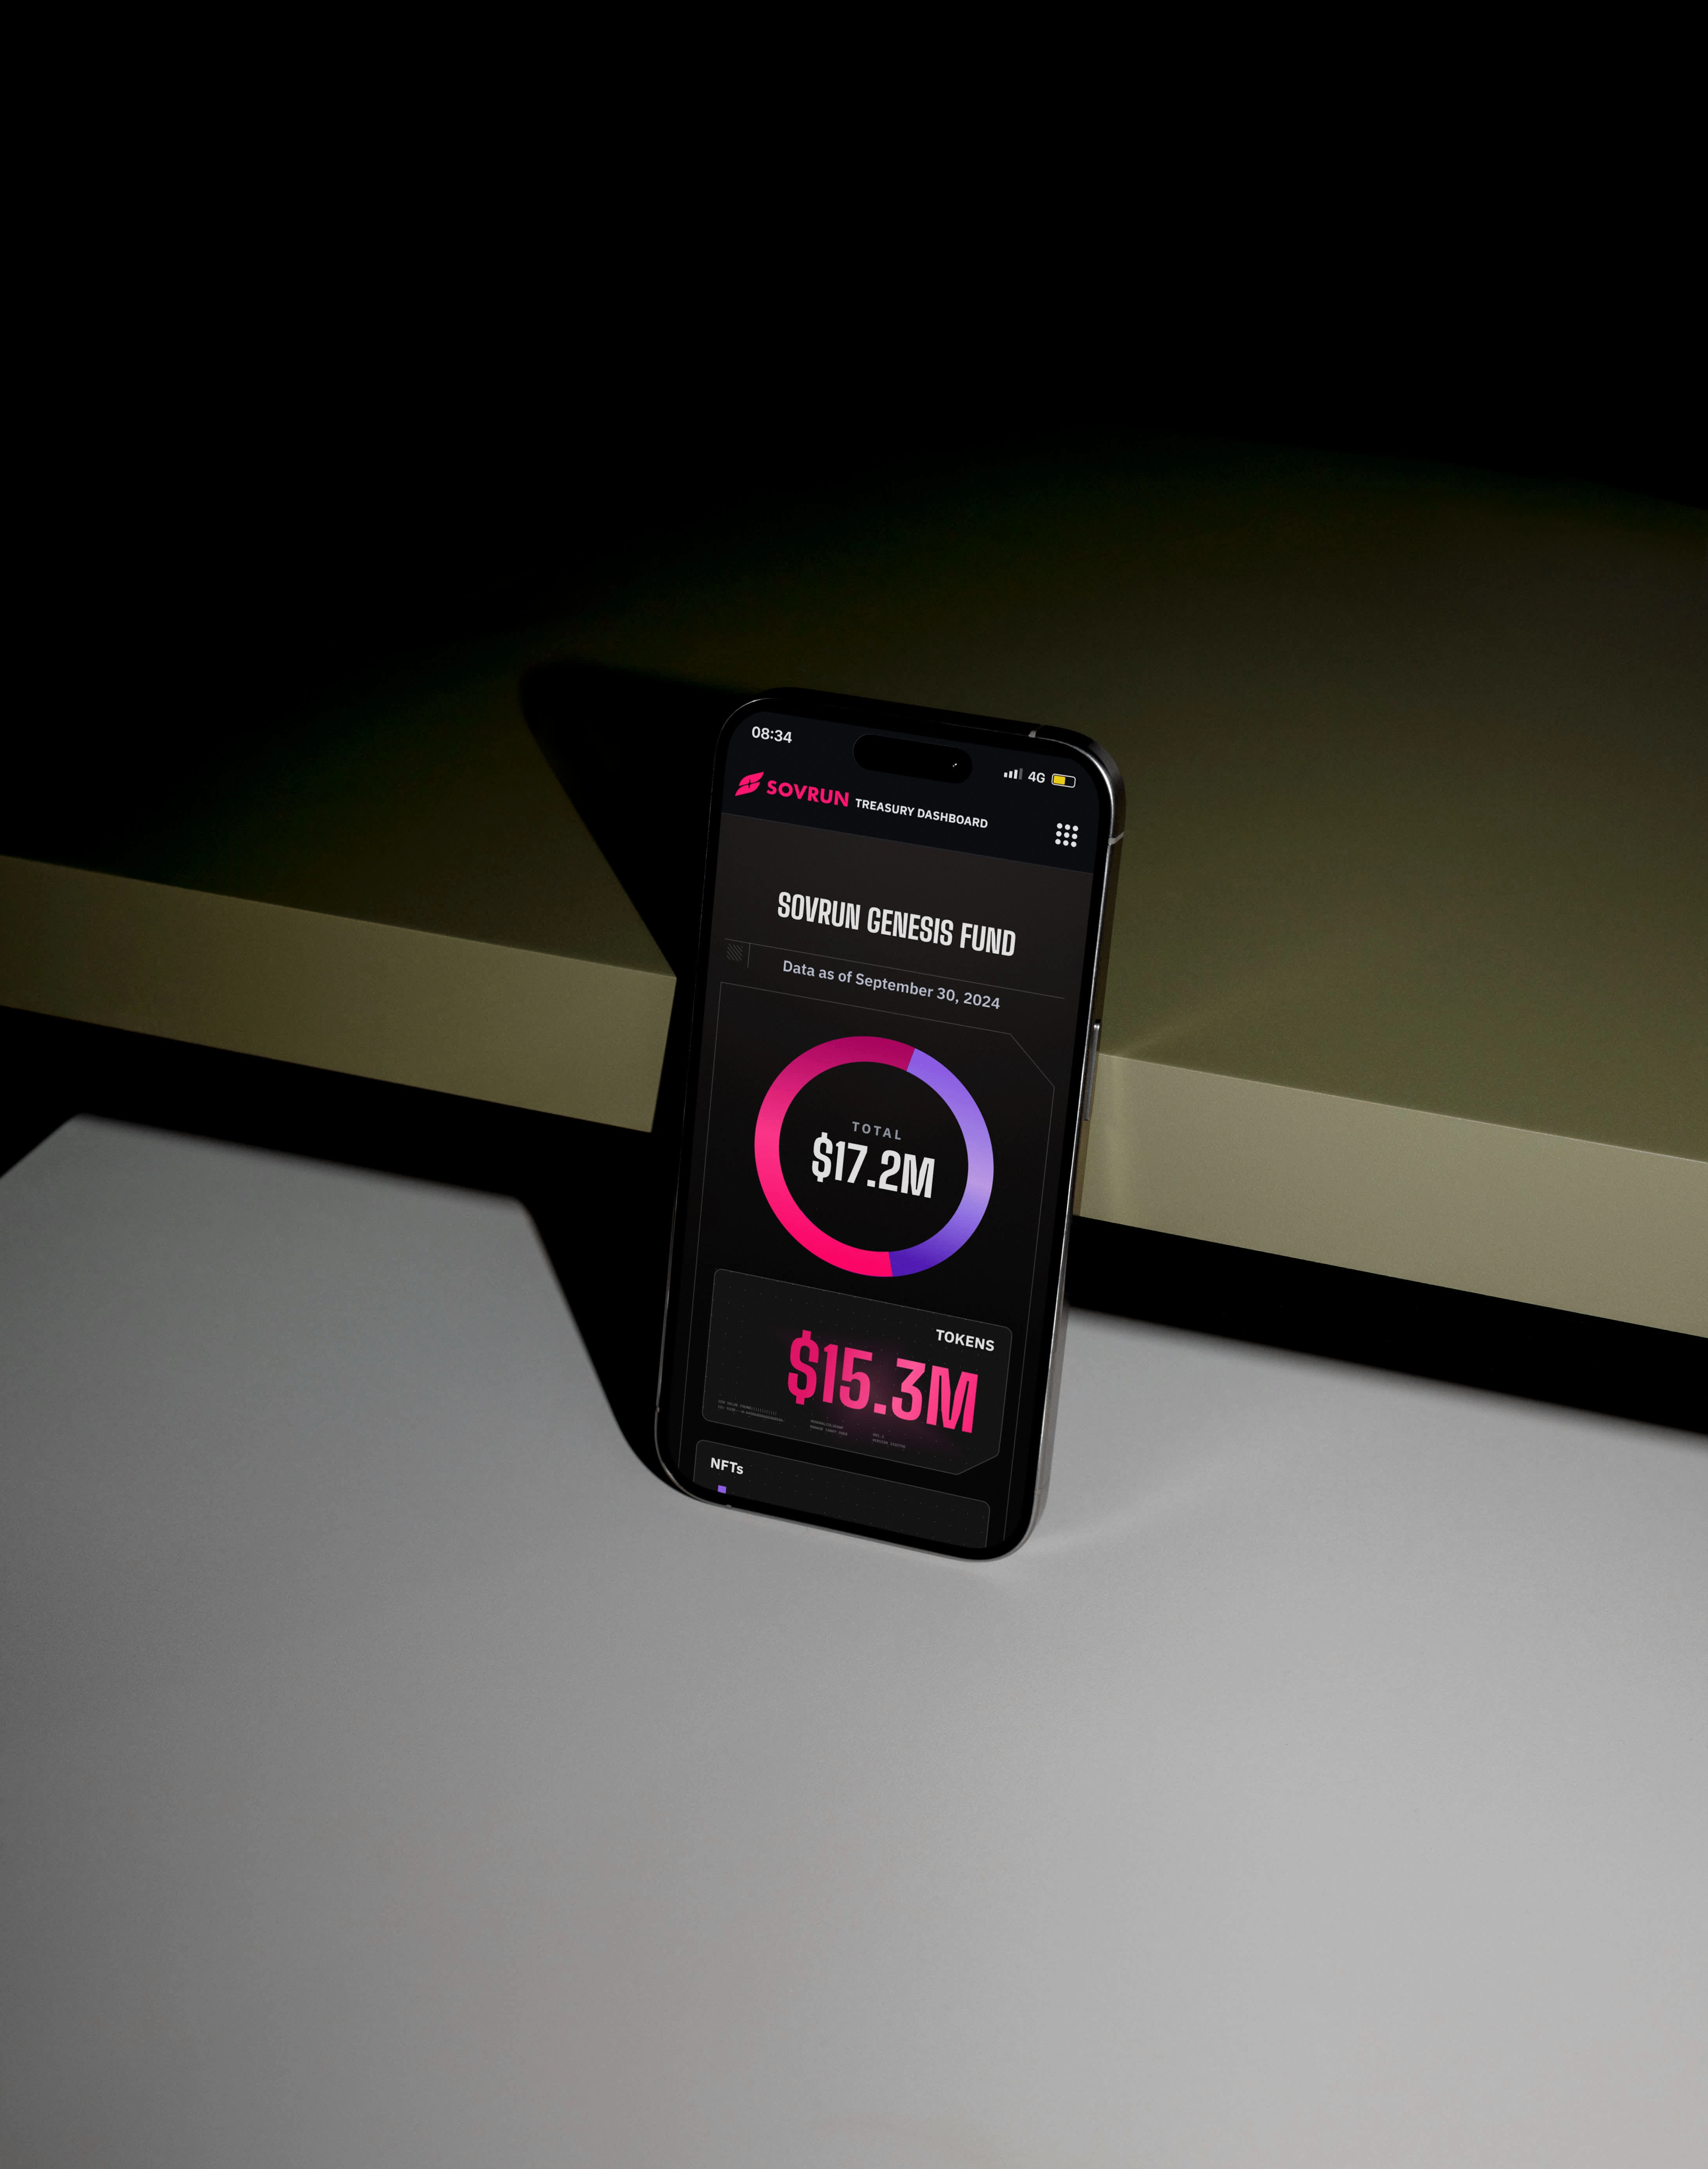
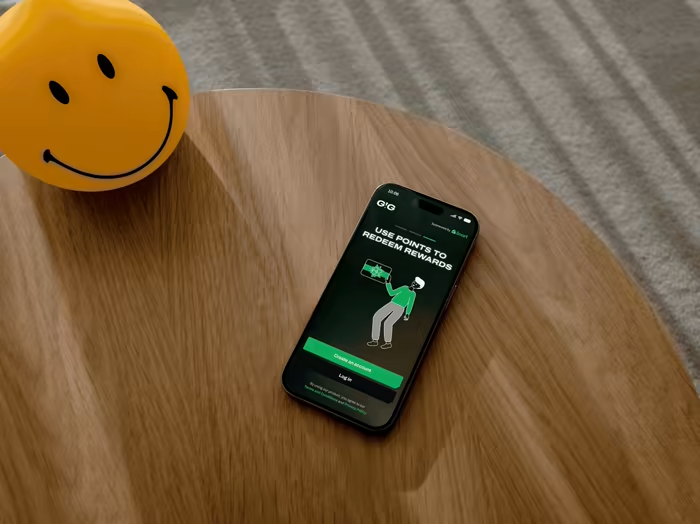
Mobile version
No more outdated reports. The dashboard pulls live data automatically, so everyone stays in sync with the latest numbers. Whether you're in a board meeting or checking stats on your phone, you'll always have current information at your fingertips.
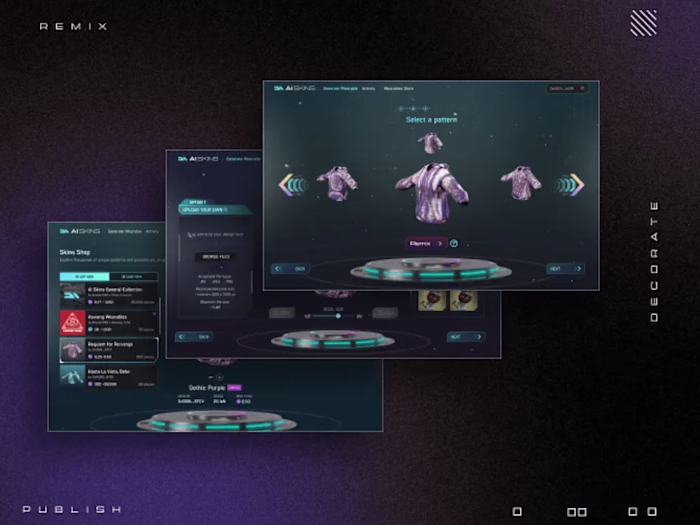
Sovrun's Genesis Fund Report
The website's legal pages
The Results
The dashboard changed the game for how Sovrun shares their financial data. Instead of drowning in numbers, users now get clear insights at a glance. The engaging design keeps people coming back, while the lightning-fast performance means no one's waiting around for data to load.
Why This Matters For Your Business
This project shows how modern web development can transform complex data into engaging experiences. Whether you're dealing with financial data, customer metrics, or any other business intelligence, I can help you:
Make complex data easily digestible
Create engaging user experiences
Build fast, reliable web applications
Keep your information current and accurate
Want to create an extraordianary web experience? Let's talk about how we can bring your vision to life!
Like this project
Posted Feb 12, 2025
📊 A data visualization website for Sovrun's Treasury Report, highlighting key metrics on its holdings and financial reserve.
Likes
1
Views
22