Retail Sales Performance Dashboard —

RIPSUDHAN MISHRA


Retail Sales Performance Dashboard — Retool + PostgreSQL
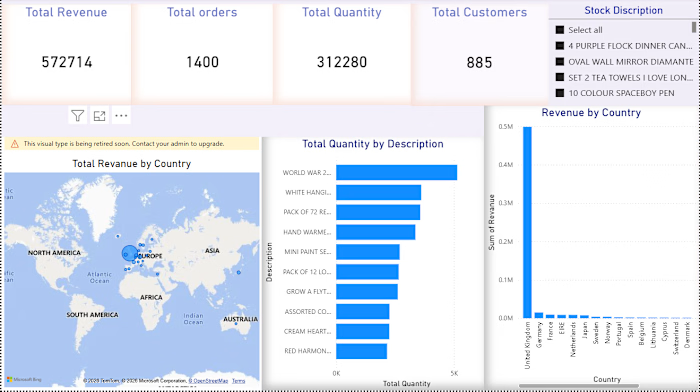
A full sales analytics dashboard built in Retool, backed by a real ~10,000-row retail dataset — revenue trends, category performance, regional breakdowns, and top products, all queried live with SQL.
What's in it:
---> KPI summary cards showing total revenue and total profit across the full dataset
---> A monthly revenue trend chart showing seasonality and growth over time
---> A category breakdown showing how sales are distributed across product categories
---> A top-10 products table ranked by revenue, with units sold
---> A regional performance breakdown comparing sales and profit across regions
Like this project
Posted Jul 25, 2026
Retail Sales Performance Dashboard — Retool + PostgreSQL A full sales analytics dashboard built in Retool, backed by a real ~10,000-row retail dataset — reve...
Likes
0
Views
4